
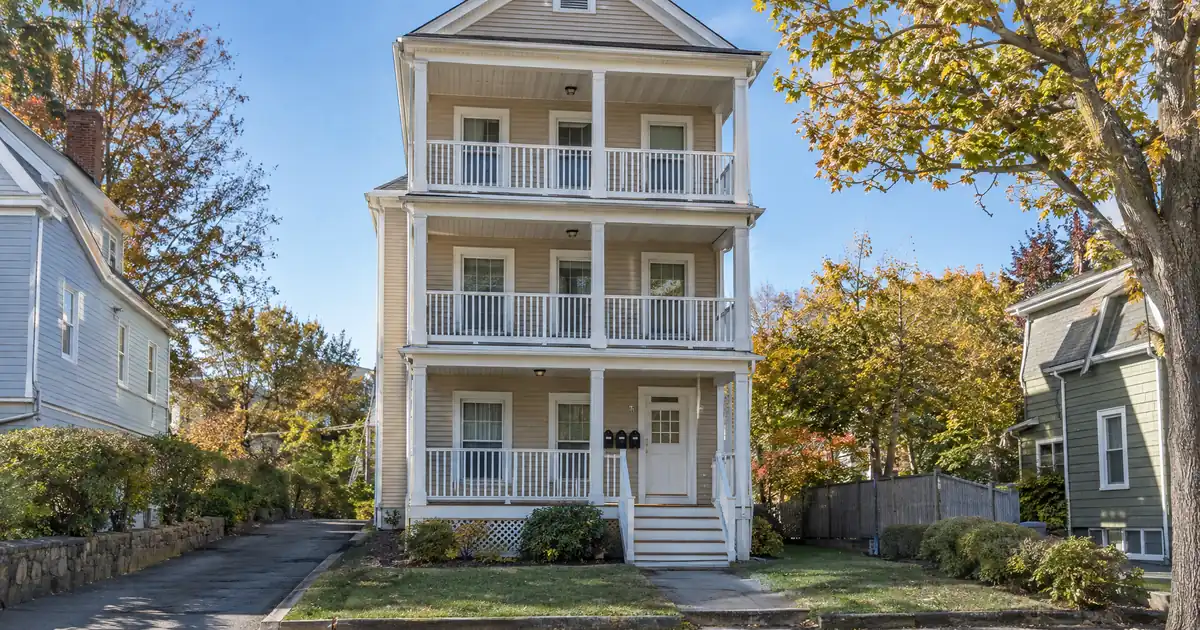
An out-of-state investor scanning Peabody sees a $677,161 median sale price per Redfin and assumes the rents must be strong to match. They are, depending on whose number you believe. Census median gross rent is $2,059 according to City-Data, while Zumper shows an average of $2,496. That gap is the whole story for a cash-out refinance here. The property you already own either clears coverage at 75 percent leverage or it doesn’t, and the answer changes sharply by unit type and by which rent source you trust.
The Quick Read: Peabody, Massachusetts suits investors who own a seasoned two- or three-family building and want to pull equity at up to 75 percent loan-to-value, because the refinance is underwritten primarily on the property’s rental income measured against its full monthly obligation, and stacked units carry coverage better than single-family houses here.
DSCR Cash-Out Calculator
Run the cash-out numbers in Peabody, MA
Rate source: Freddie Mac 30-yr average via FRED® — Federal Reserve Bank of St. Louis · effective Sep 24, 2026
Prefilled with starting assumptions — enter your property’s value, balance, taxes, and insurance for a more accurate picture.
Program parameters update from Lendmire’s centralized guideline source. Taxes and insurance are editable estimates.
As of Sep 24, 2026 · General Freddie Mac market benchmark, not a Lendmire loan offer. Property value, balance, taxes, and insurance are editable estimates. Maximum loan-to-value varies by lender, program, property type, and seasoning. Not a Loan Estimate, approval, or commitment to lend. Program availability and eligibility are subject to lender guidelines, credit approval, property review, and underwriting.
- Multi-family listings carry a median ask near $849K, per Redfin.
- Seasoning runs about six months from title recording, with cash-out capped at 75 percent LTV.
- Rent sources conflict, so underwrite toward the low end, not the new-construction asking numbers.
- Prices are flat to soft, so proceeds depend on the appraisal, not on assumed appreciation.
- West Peabody single-family at roughly $760K likely lands below 1.00 coverage.
Peabody Market Snapshot
A quick read on the Peabody investor landscape — figures come from the cited sources below. Confirm current property-level numbers before underwriting.
| Metric | Detail |
|---|---|
| Home prices | $849K median across 8 listings (Redfin, multi-family Peabody) |
| Typical rents | $2,059 (City-Data) |
| Population | 54,695 population (Census Reporter) |
Equity Here Comes From the Purchase, Not the Market
Peabody equity is earned at the closing table or through renovation. It is not handed to you by the market. Redfin shows the citywide median sale price down 2.1 percent year over year, while Zillow’s value index shows a gain of 0.7 percent. Flat is the honest read.
Town Center is noisier. Redfin’s neighborhood page showed the median down 19.1 percent year over year at one point, off a small sample, and Homes.com shows it down 7 percent at $525,000. Small-sample swings like that are exactly what makes appraisal risk real on a refinance.
So who benefits? An investor who bought a tired three-family below its stabilized value, fixed it, and has held it at least six months from title recording. An investor counting on the last few years of price gains to bail out thin equity should pause. This one is a toss-up depending on basis: strong for a disciplined buyer, thin for a late one.
For the mechanics, the ceiling is 75 percent LTV on cash-out. Never 80, which is the purchase figure. Eligibility generally runs through a 1.00 coverage benchmark, credit tiers starting around 620, and roughly six months of PITIA in reserves, all subject to lender guidelines. The cash you walk away with depends on appraised value, rent used for lender review, and reserves. It isn’t a number to promise yourself in advance. The guide “The Refi Options” covers the full structure, and the DSCR fundamentals cover the ratio itself.
Why Stacked Units Win the Coverage Fight
Multi-family is where Peabody’s coverage math works, and detached houses are where it strains. Census-derived mean values from City-Data run $518,352 for two-unit and $520,482 for three-to-four-unit structures, against $723,864 for detached homes. Those are means, not current sale prices. The direction still holds: more rent doors per dollar of value.
Active listings on Homes.com range from $750,000 to $2,750,000. One example is a three-family with three two-bedroom, one-bath units, listed with rents below market and long-term tenants. Another is a six-unit mixed-use building south of Peabody Square with four residential and two commercial units. Mixed-use with commercial space may not fit standard residential DSCR programs, so confirm with the lender before you count on it for a refinance.
Run the screening arithmetic. At Zumper’s two-bedroom average of $2,864, two units gross about 8 percent of an $849K price annually. A single house at Zumper’s $3,950 average against the $677,161 citywide median works out nearer 7 percent. It’s a rough screen, since one is a listing average and the other a sale median. But the extra gross yield from stacking is what carries debt coverage at a given loan size.
Also worth knowing: multi-family stock sells in about 18 days on Homes.com, and 16 days in Town Center. That helps an appraiser find recent comps. The catch is depth. Redfin counted only 22 sales in West Peabody in a recent month, and 2-4 unit sales are fewer still. Budget a conservative value.
The Rent Number You Pick Decides the Deal
Peabody’s rent data is a mess, and treating it that way is an edge. Here’s how the sources stack up:
| Source | Figure | Scope |
|---|---|---|
| Census ACS (City-Data) | $2,059 median gross | All rentals |
| Apartment List | $2,137 median | Listings |
| Zumper | $2,496 average | Listings |
| RentCafe | $2,755 average | 50+ unit buildings only |
Apartment List shows rents down 1.4 percent year over year. Zumper shows them up 3 percent. RentCafe’s figures cover only large complexes, and communities like Alexan Peabody sit in that data. Don’t underwrite a 1920s two-family at new-construction asking rents. The appraiser’s rent schedule and the lender’s rent used for lender review will drift toward the lower sources.
I found no measured vacancy rate and no cap-rate source for Peabody, so any article quoting a precise one is guessing.
Running the Numbers (Modeled, Not Quoted)
These are modeled assumptions, not market data. Coverage below is rent divided by full PITIA, including taxes and insurance.
Three-family, haircut rents. Say you own a three-family appraising near the $849K multi-family listing median. Refinance at 75 percent LTV, and model each two-bedroom at the Census median of $2,059. Coverage lands around 1.15x. That clears the 1.00 benchmark with some cushion. If the units actually rent near Zumper’s $2,864 two-bedroom average, coverage runs above 1.5x. Lenders review it in terms of the rents they will accept, so the appraisal rent schedule matters more than what you hope to charge.
West Peabody single-family. Now consider a house appraising near $760K, the area’s recent median per Redfin, at Zumper’s $3,950 house average. Coverage comes out around 0.8x including taxes and insurance. Not close. Some select lenders review sub-1.00 scenarios, but the file gets harder: lower leverage, stronger credit, deeper reserves, and different pricing. An interest-only structure or a sub-1.00 program may be worth pricing out, subject to lender guidelines and property review. For cash-out purposes, that is a weaker candidate than the three-family.
DSCR files in markets like this one typically look like a stacked-unit building with decent equity and a rent schedule that is the real fight. The borrower’s in-place leases sit below the lender’s market rent, or the reverse, and the file turns on which figure the appraiser lands on. The cleaner files arrive with leases, a documented rent history, and a clear seasoning date already in hand.
If the building is held in an LLC, that can work subject to lender program eligibility. Property types like manufactured homes, log homes, and barndominiums fall outside these programs entirely, so confirm your asset type first.
Where the Tenants Come From
Peabody is a bedroom market for the Route 128 and I-95 corridor. Per City-Data, the daytime population falls by 4,626 (8.3 percent) because of commuting, and 26.9 percent of workers live and work in the city. Tenant demand therefore leans on employment outside the city line.
Inside it, Data USA shows health care and social assistance as the largest resident-employment sector, ahead of retail and manufacturing. Peabody is home to Lahey Clinic, Peabody, which runs a hospital with a 24-hour emergency department, and Boston Children’s Hospital also has a presence in the city. Northshore Mall is described by Business In Focus as the city’s largest employer and taxpayer. That mix of health care, retail, and light industry diversifies demand, so no single employer sinks the rent roll.
Peabody is also one of 26 Gateway Cities, per the North Shore Alliance for Economic Development. There’s no major university here, so student demand is secondary. The tenant base is working households and commuters.
Where the Equity Pencils
Town Center and South Peabody. This is where stacked units cluster. Town Center is the entry-price market, with Zumper calling it the most affordable area at about $2,000 a month. South Peabody averages about $2,259 and sits near Lynn, Salem, and Route 1. Rent against price in Town Center screens at roughly 4.7 percent gross, an all-types median against a listing average, so treat that as a rough read only. The caution: Town Center’s appraisal volatility is the highest in the city. Do not plan a refinance around a value you haven’t priced with a conservative appraiser.
Downtown multi-family. Redfin shows downtown multi-family listings at $877K across four listings. Dense, walkable, and the core of the stock that suits cash-out. Expensive per door, though, so run coverage on the lender’s rents.
Centennial Park, Route 1, and Route 114. These are employment and retail nodes, with apartment communities such as Alexan Peabody and Highlands at Dearborn. Large-complex product is not what most small investors own. Read it as a rent ceiling, not a comp.
West Peabody. Skip it for cash-out coverage on single-family. Quality area, expensive entry, and the math doesn’t clear on house rents.
One small edge: Peabody Municipal Light Plant serves about 26,000 customers, per PMLP, and FindEnergy shows a residential price of 15.78 cents per kilowatt-hour against 27.40 cents statewide. Lower power costs help tenant affordability where rents are high. Uncommon for a city this size, though not unique.
What Happens to the Proceeds
Cash-out on a Peabody three-family is capital, so the question is where it goes. Most investors recycle it into the next building, and the same rent-source discipline applies. Don’t pull the maximum just because the ceiling allows it. In a flat-price market, over-leveraging an asset to buy another one concentrates appraisal risk twice. The stronger play might be leaving a margin for reserves and pulling less. Investors chasing appreciation could argue otherwise, but with prices this flat, that argument is weak.
Weigh the structure against a conventional comparison if you have strong traditional employment income. For statewide context, see Massachusetts DSCR financing. Confirm current local rental rules, property taxes, and insurance with qualified local professionals before you underwrite. To price a specific building, get a DSCR quote or call 828-256-2183.
DSCR vs. conventional financing
There are two common ways to finance an investment property in Peabody, MA, and they qualify you differently — here’s how investors weigh them.
Why investors choose it
- Qualifies on the property’s rental income — no personal tax returns, W-2s, or pay stubs needed to document income.
- No personal debt-to-income ceiling to clear, so existing mortgages and obligations don’t cap your borrowing the same way.
- Can be closed in an LLC, keeping the property inside a business entity.
- Built for scaling — not held to the limit on number of financed properties that conventional financing applies.
- Underwriting centers on the deal: generally qualifies when the rent covers the payment, a 1.00x coverage ratio being a common baseline (confirmed in underwriting).
- Designed specifically for investment property, including long-term and, where the program allows, short-term rentals.
Where it’s strong
- Often the lowest ongoing financing cost for a buyer who fully qualifies on personal income — a fit for a first property or a cost-first purchase.
Trade-offs for investors
- Requires full personal income documentation and must fit within a debt-to-income limit — salary, existing debts, and other mortgages all count.
- Typically held in your personal name rather than a business entity.
- Caps how many financed properties you can carry, which can become a ceiling as a portfolio grows.
- Evaluates you as a borrower as much as the property, which usually means more paperwork.
How investors usually choose: a first or single property often optimizes for the lowest financing cost; portfolio builders often optimize for leverage, vesting in an LLC, and scaling past conventional caps. The right answer depends on your goals, the property, and current guidelines — both paths run through select lenders in Lendmire’s wholesale network, with eligibility and terms confirmed in underwriting.
Frequently Asked Questions
How do you qualify for a DSCR cash-out refinance in Peabody?
Qualification is built around the property’s rent against its full monthly obligation, with 1.00 as a common benchmark, a credit score generally at or above 620, and roughly six months of PITIA in reserves. The property typically needs about six months of ownership from title recording. Final eligibility depends on lender guidelines, credit, and property review.
What are the requirements for an investment property loan in Peabody, Massachusetts?
Typical requirements include the credit and reserve ranges above, an appraisal supporting the value, and a rent schedule supporting coverage. Loan amounts generally go up to $3,000,000 on standard programs. Cash-out is capped at 75 percent LTV, and smaller balances route through select lenders.
Can a Peabody three-family clear 1.00 on a cash-out?
Often, if the rents hold. On modeled math at the Census median rent per unit and 75 percent LTV, a three-family lands around 1.15x including taxes and insurance. Rents closer to listing averages push it higher. A single-family house in West Peabody likely lands below 1.00 at the same leverage.
Does a mixed-use building near Peabody Square qualify?
Not always. Small mixed-use buildings with commercial ground floors may not fit standard residential DSCR programs, and underwriting can differ. Check with the lender before counting on one for a refinance.
Closing Thought
The investors who underwrite Peabody’s three-families on haircut rents and a conservative appraisal right now will come out ahead.
For current guidelines and terms, see Lendmire’s DSCR loan programs page.
About Lendmire
Lendmire (NMLS# 2371349), a non-QM mortgage broker serving investors in 41 markets including Washington, D.C., helps structure DSCR scenarios evaluated around a property’s rental income rather than personal income paperwork, subject to lender guidelines. A Scotsman Guide Top Mortgage Workplace in 2025 and 2026, Lendmire was recognized by Scotsman Guide as a 2026 Top Workplace and recognized by Scotsman Guide in 2025, as covered in the 2026 Top Workplace recognition announcement. It places loans through wholesale investor lenders and is not a direct lender.
Get Started
Ready to find the right loan for you?
In about 30 seconds you can review financing options available for your investment property. No commitment required.
Informational only. Not a Loan Estimate, approval, or commitment to lend. Program availability and eligibility are subject to lender guidelines, credit approval, property review, and underwriting.
References
3. Zumper, Peabody rent research
4. Redfin
7. Homes.com
9. RentCafe’s
10. Redfin
14. North Shore Alliance for Economic Development
15. PMLP
16. FindEnergy
17. recognized by Scotsman Guide as a 2026 Top Workplace
18. recognized by Scotsman Guide in 2025
19. the 2026 Top Workplace recognition announcement
This article is part of Lendmire’s investment property cash-out refinance program — full qualification details, guidelines, and scenarios live on the program page.
Guides: Investment Property Cash-Out Refinance in Peabody, MA · Investment Property Cash-Out Refinance in Massachusetts
Brandon Miller
Founder & CEO, Mortgage Loan Originator, Lendmire LLC
- Mortgage Loan Originator · NMLS# 1129696 · Verify on NMLS Consumer Access
- North Carolina Real Estate Broker · License# 343312 · Verify on NCREC
- North Carolina Insurance Producer · License# 19053198 · Property, Casualty, Life, Health · Verify on NAIC SBS
- Lendmire LLC · Firm NMLS# 2371349 · Verify firm licensure
Disclosures. The information presented in this article is general market commentary, not financial, legal, or tax advice. Lendmire is a mortgage brokerage (NMLS# 2371349) — not a direct lender or depository institution — and loan placement is subject to lender underwriting. Nothing in this content represents a commitment to lend. Loan terms, pricing, and program availability vary based on borrower qualifications, property characteristics, and state of subject property, and are subject to change at any time. Lendmire complies with Equal Housing Opportunity requirements. Consumer access: nmlsconsumeraccess.org.