
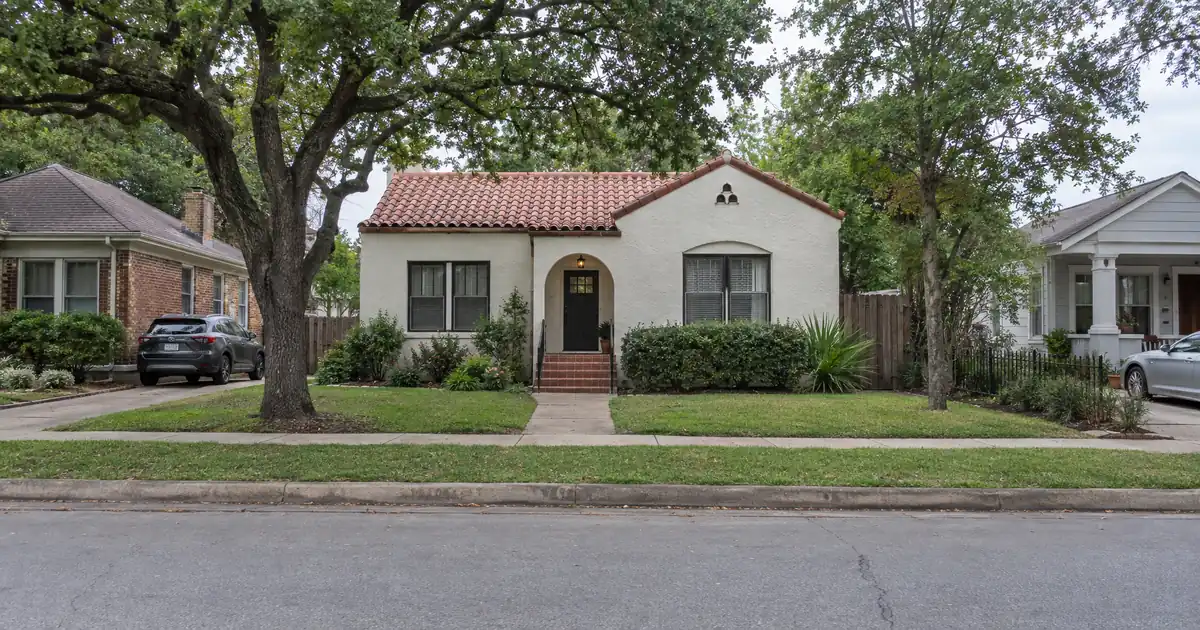
San Antonio added 23,900 residents in a single year, the fourth-largest numerical gain of any U.S. city, according to Census Bureau numbers reported by San Antonio Current. That kind of growth fills rentals. It doesn’t automatically build the equity a cash-out refinance needs. Prices here have plateaued, apartment concessions are heavy, and the investors who can still pull meaningful proceeds are mostly the ones who bought low, bought small, and kept tenants in place.
At a Glance: A DSCR cash-out refinance in San Antonio, Texas fits investors who hold tenant-occupied duplexes through fourplexes bought at a low basis, because the loan is underwritten primarily on the property’s rental income measured against its full monthly obligation, and available proceeds are capped by a 75% LTV ceiling rather than by personal income. Every figure here varies by lender and program — guidelines, property type, leverage, and credit profile all apply.
DSCR Cash-Out Calculator
Run the cash-out numbers in San Antonio, TX
Rate source: Freddie Mac 30-yr average via FRED® — Federal Reserve Bank of St. Louis · effective Sep 24, 2026
Prefilled with starting assumptions — enter your property’s value, balance, taxes, and insurance for a more accurate picture.
Program parameters update from Lendmire’s centralized guideline source. Taxes and insurance are editable estimates.
As of Sep 24, 2026 · General Freddie Mac market benchmark, not a Lendmire loan offer. Property value, balance, taxes, and insurance are editable estimates. Maximum loan-to-value varies by lender, program, property type, and seasoning. Not a Loan Estimate, approval, or commitment to lend. Program availability and eligibility are subject to lender guidelines, credit approval, property review, and underwriting.
- Median sale price is $329,730, per SABOR, against a statewide $348,500.
- Large-complex apartment vacancy hit 15.7%, per CultureMap citing CoStar. In-place leases matter.
- Joint Base San Antonio directly employs 82,000-plus, per Greater SATX.
- Coverage is strongest in the low-basis urban core. It’s weakest in Alamo Heights and Stone Oak.
Lendmire (NMLS# 2371349) helps arrange DSCR financing for San Antonio, Texas investors through wholesale and investor-lending channels across 41 markets, including Washington, D.C. This piece stays on one question: what happens after you already own the property and want capital out of it. For the Texas-wide picture, see the Texas DSCR investor loans hub.
San Antonio Market Snapshot
A quick read on the San Antonio investor landscape — figures come from the cited sources below. Confirm current property-level numbers before underwriting.
| Metric | Detail |
|---|---|
| Home prices | Median $329,730 (SABOR June 2026 press release) |
| Cap rates | <5% (LRG Realty (2 pages)) |
| Employment | 116,000 jobs (San Antonio Medical Foundation) |
| Vacancy | 16% to 14.9% (San Antonio Report) |
Equity Is the Constraint, Not Access
Getting a cash-out loan in San Antonio isn’t hard. Finding enough equity to pull is. SABOR’s June market release puts the median sale price at $329,730, up 4% year over year, with 77 days on market and 6.13 months of inventory. The same release shows the statewide median at $348,500, so San Antonio is the cheaper entry among the big Texas metros. Cheap entry cuts both ways. A lower basis means less absolute dollar equity to extract.
Homes.com puts the citywide median lower, at $319,000, on a different methodology. It frames that number against a prior peak of $335,000 in its housing market report. Read the two together and the message is the same: San Antonio prices are hovering near a plateau, not compounding.
Consider the owner who bought a rental near that prior peak. After a few years of flat values, the balance may sit close to 70% of today’s appraised value. A 75% LTV ceiling leaves almost nothing to pull once closing costs come out. Now flip it. Picture an investor who bought an older fourplex in the urban core well below market, renovated it, and stabilized leases. That owner has forced equity, and the cash-out works. Final terms depend on lender guidelines, property type, leverage, and the borrower’s complete credit picture.
Price growth won’t do the job in this market. Basis and rehab will.
What the 75% Ceiling and Six-Month Clock Mean Here
Most cash-out DSCR files are shaped by a handful of guidelines, and this market makes each one matter. Ownership seasoning typically runs about six months, measured from title recording. Leverage on a cash-out tops out at 75% LTV, well below the 80% ceiling on a purchase. Reserves generally sit near six months of PITIA, stepping up to about nine months on balances above $1,500,000. Credit tiers start at a 620 floor and improve pricing eligibility through 660, 680, and 700. And most standard programs are built around a 1.00x benchmark, meaning the rent used for lender review covers the full payment including taxes and insurance. Some lenders review lower ratios with less leverage and stronger compensating factors. All of this is subject to lender guidelines, credit approval, and property review.
The proceeds figure isn’t a number anyone can promise. It comes from rent used for lender review, the full monthly obligation, reserves, and that 75% cap, in that order. If you hold title in an LLC, that’s workable subject to lender program eligibility. Lendmire’s DSCR guide covers the underwriting basics. Where DSCR and conventional diverge matters mostly for self-employed owners with messy traditional personal-income documentation. The investor refinance breakdown compares rate-and-term against cash-out structures, and the equity recycle pathway walks through how proceeds become the next down payment.
Where Small Multifamily Pencils
The urban core and near-core older stock are where the coverage math is strongest, and the Medical Center vicinity is the most reliable tenant story. Rent-to-value is highest where basis is lowest. Sourcing is mixed, so treat the numbers below as indicative.
Dignowity Hill and Tobin Hill. LRG Realty, a brokerage, says small multifamily is available at relatively modest price points in both neighborhoods. Its broader argument is that lower-basis urban-core property tends to show a stronger gross rent-to-price ratio than north-side property, and it illustrates the point by comparing a low-basis Prospect Hill single-family rental with a much higher-priced Stone Oak property. Under its modeled assumptions, including taxes and insurance, the first clears a 1.0 coverage ratio comfortably while the second falls short. Take this as a brokerage claim, but the direction matches how the math works. The catch is that low basis caps the dollars you can pull, and quoted rents may not hold. Tobin Hill rent listings skew toward new apartments, not duplex rents, so don’t underwrite off them. These specifics are subject to lender guidelines and a full review of property, leverage, and credit.
Medical Center. Homes.com shows a median home price of $207,000, with multifamily listings ranging from $229,000 to $497,000. That’s a small snapshot, not a trend. The demand is real, though. A 2024 impact study from the San Antonio Medical Foundation counts 30,140 jobs in the core area, and the San Antonio Report cites fourteen hospitals in the district. UT Health San Antonio is now part of UTSA, which surpassed 42,000 students after the merger. Hospital and university payrolls anchor lease renewals here better than almost anywhere else in the city.
Westside and the Lackland corridor. Apartments.com lists average rent of $791, with 2BR near $1,016 and 3BR near $1,183, though those are apartment averages. Joint Base San Antonio’s 82,000 direct jobs (211,000 counting indirect) give the corridor a deep employment base. Rents are modest, so coverage depends entirely on a low purchase basis. No reliable median sale price turned up, so run each deal on its own numbers.
Alta Vista, Monte Vista, and Mahncke Park. Older duplex, triplex, and fourplex stock keeps showing up in listings. No dependable rent or price statistics exist for these areas, so anything more specific would be invented.
Skip Alamo Heights and Stone Oak (for Cash-Out)
For cash-out, Alamo Heights and Stone Oak are the wrong places to chase coverage. Value runs too high relative to rent, and 75% LTV amplifies the problem. Terms vary by lender guidelines, property type, leverage, credit profile, and full file review.
LRG puts Alamo Heights medians at $550,000 to $750,000, with single-family cap rates below 5% on most rentals. Northpoint Property Management uses a rule of thumb where 0.7% monthly rent-to-price is workable for cash flow and anything under 0.5% is an appreciation bet. It puts newer suburban builds at 0.4% to 0.5%. That 0.7% marker lines up with the modeled math: at 75% LTV with taxes and insurance, it lands near 1.0x. At 0.5%, coverage falls to roughly 0.7x.
Sub-1.00 files aren’t dead, but they get harder. A lender may review a sub-1.00 program, an interest-only structure, or a lower cash-out request, and qualification is subject to guidelines, credit approval, and property review. Expect reduced leverage and stronger credit to be part of the conversation. The far north and northwest also carry the heaviest new apartment supply, according to Neiboroughly, a secondary source that’s directional at best. Newer stock there rarely fits small-multifamily math anyway.
Run the Numbers on a Fourplex
Take a hypothetical fourplex valued at $350,000, in line with the sub-$350,000 small multifamily LRG describes. Assume, as a modeled input and not a market fact, $1,000 per unit in rent, or $4,000 total. That’s a rent-to-value ratio a bit above 1.1% monthly. At 75% LTV, with taxes and insurance in the debt service, coverage comes in around 1.6x. Haircut rents 10% for concessions and coverage stays near 1.5x. The property clears the 1.00x benchmark with room, subject to reserves, credit, and appraisal. Exact terms depend on the lender’s guidelines, property type, leverage, and a full review of the borrower’s file.
For comparison, a private lender’s older case study described a San Antonio fourplex valued at $365,000, taken to 65% LTV, leasing at $3,430 a month for 1.35x coverage. That’s an old data point, and it’s useful only as a demonstration that fourplex rents stack against a low basis. It says nothing about today’s rents.
Here’s a pattern that matters. DSCR files in markets like this one typically look like a tenant-occupied 2–4 unit property where the deal lives or dies on the appraiser’s rent schedule and how much leverage the file can hold. Borrowers who bring current leases and fresh insurance quotes tend to see fewer surprises than those who lean on pro forma rents. In a market with heavy concessions, the in-place lease is the strongest document in the file.
Multifamily rents run lower per unit than single-family. A local property manager’s rental report puts average single-family rent at $2,001.82 and multifamily unit rent at $1,347.92. Treat those as ballparks since the multifamily definition is unclear. A single-family house needs a much lower price to match the coverage of a fourplex.
Vacancy: Read It Correctly
Large-complex apartment vacancy is elevated, and that shapes how lenders and appraisers read San Antonio rents. CoStar data cited by CultureMap shows vacancy at 15.7% in the first quarter, with 31.6% of landlords offering concessions and discounts averaging 11.6%. The San Antonio Report later showed vacancy easing from 16% to 14.9%, with rents down 2% to 3.5% and CoStar’s analytics director expecting the market to flip within a couple of years. Colliers reports the construction pipeline contracted for twelve straight quarters, with 2,638 units underway and occupancy up to 93.1%.
This is corporate apartment data, not 2–4 unit data. It still caps rent growth for competing product. RentCafe shows average apartment rent of $1,264, down 2.65% year over year, and Zumper puts 3BR at $1,650 across all property types. Underwrite flat rents. A lender may haircut market rent on properties without in-place leases, which favors tenant-occupied small multifamily over vacant value-add deals.
Some owners in this market face a real fork. Refinancing now locks in equity at a soft appraisal. Waiting for the projected tightening could mean a stronger value, but carries the risk that it doesn’t arrive on schedule. There’s no clean answer. For owners whose numbers clear comfortably today, pulling capital now and holding through the cycle is the defensible play. Investors weighing that decision can request a scenario review or call 828-256-2183.
Where the Proceeds Go
A cash-out that funds a down payment on the next low-basis fourplex compounds. A cash-out that sits in a savings account doesn’t. With prices flat, the highest-value use of proceeds in San Antonio is usually buying below market and forcing equity through rehab, not waiting for appreciation. That’s also how the next refinance gets its equity.
Investors should also verify current local rental rules, taxes, and insurance with qualified local professionals before sizing any deal. Those inputs move the coverage number, and they vary by property.
Frequently Asked Questions
How long do I need to own a San Antonio property before a DSCR cash-out?
Typically about six months of ownership, measured from title recording. That clock is a program guideline, not a city rule, and it varies by lender. Owners who paid all cash, or who added value through renovation, may still find the appraised value supports proceeds even at that early stage.
Does high apartment vacancy hurt a fourplex cash-out in San Antonio?
Only indirectly. The citywide vacancy figure comes from large apartment complexes, not 2–4 unit buildings. But concessions on competing apartments can push appraisers and lenders to set market rent conservatively. Tenant-occupied properties with current leases are the cleaner file, while vacant units with no lease history invite a rent haircut.
DSCR vs. conventional financing
Two common ways to finance an investment property in San Antonio, TX. They qualify you differently — here’s how investors weigh them.
Why investors choose it
- Qualifies on the property’s rental income — no personal tax returns, W-2s, or pay stubs needed to document income.
- No personal debt-to-income ceiling to clear, so existing mortgages and obligations don’t cap your borrowing the same way.
- Can be closed in an LLC, keeping the property inside a business entity.
- Built for scaling — not held to the limit on number of financed properties that conventional financing applies.
- Underwriting centers on the deal: generally qualifies when the rent covers the payment, a 1.00x coverage ratio being a common baseline (confirmed in underwriting).
- Designed specifically for investment property, including long-term and, where the program allows, short-term rentals.
Where it’s strong
- Often the lowest ongoing financing cost for a buyer who fully qualifies on personal income — a fit for a first property or a cost-first purchase.
Trade-offs for investors
- Requires full personal income documentation and must fit within a debt-to-income limit — salary, existing debts, and other mortgages all count.
- Typically held in your personal name rather than a business entity.
- Caps how many financed properties you can carry, which can become a ceiling as a portfolio grows.
- Evaluates you as a borrower as much as the property, which usually means more paperwork.
How investors usually choose: a first or single property often optimizes for the lowest financing cost; portfolio builders often optimize for leverage, vesting in an LLC, and scaling past conventional caps. The right answer depends on your goals, the property, and current guidelines — both paths run through select lenders in Lendmire’s wholesale network, with eligibility and terms confirmed in underwriting.
Can I cash out if I bought near the prior price peak?
Possibly, but proceeds may be thin or zero. Homes.com shows the current median sitting just under the prior peak, so owners who bought then may have little appreciation to draw on. Rehab work, rent increases, or a low original basis are what create room under the 75% LTV ceiling.
Which San Antonio submarkets are hardest for cash-out coverage?
Alamo Heights and the Stone Oak corridor tend to be the toughest. Values run high relative to rent, and rent-to-price ratios in those areas often fall short of the benchmarks investors typically look for, which makes them more of an appreciation bet than a cash-flow play, though that is a general market pattern rather than a measured figure, so check current local rent and sales data for any specific property. At 75% LTV including taxes and insurance, those properties often land below 1.00x, which means reduced leverage or a sub-1.00 program review.
Are small multifamily properties eligible, and what about five-plus units?
Duplexes through fourplexes are the natural fit. Five- to eight-unit buildings appear in San Antonio listings but may hit commercial-loan thresholds, so confirm program limits before assuming eligibility. Manufactured homes, log homes, and barndominiums fall outside these DSCR programs entirely.
The Window
Apartment concessions are heavy, the construction pipeline has shrunk for twelve straight quarters, and CoStar expects tightening ahead. The investors who pull equity from low-basis, tenant-occupied San Antonio fourplexes now will hold the capital when that market flips.
For current guidelines and terms, see Lendmire’s DSCR loan programs page.
About Lendmire
Lendmire (NMLS# 2371349), a non-QM mortgage broker serving investors in 41 markets including Washington, D.C., helps structure DSCR scenarios commonly evaluated around a property’s rental income rather than personal income paperwork, subject to lender guidelines. Recognized by Scotsman Guide in 2025 and a top-ranked workplace in 2026, Lendmire places loans through wholesale investor lenders and is not a direct lender. Details appear in the Top Workplace press announcement.
Get Started
Ready to find the right loan for you?
In about 30 seconds you can review financing options available for your investment property. No commitment required.
Informational only. Not a Loan Estimate, approval, or commitment to lend. Program availability and eligibility are subject to lender guidelines, credit approval, property review, and underwriting.
References
2. SABOR June market statistics
4. Greater SATX Regional Economic Partnership
6. San Antonio Medical Foundation
8. Homes.com — Reports San Antonio Housing Market
9. LRG Realty
10. Homes.com
11. San Antonio Medical Foundation 2024 impact study
14. Apartments.com
15. Northpoint Property Management
16. Neiboroughly
17. sarents.com — San Antonio Rental Market Report
18. Colliers
19. RentCafe
20. Zumper
21. Recognized by Scotsman Guide in 2025
22. Scotsman Guide — Top Workplaces 2026
23. the Top Workplace press announcement
This article is part of Lendmire’s investment property cash-out refinance program — full qualification details, guidelines, and scenarios live on the program page.
Related reading: Cash Out Refinance Investment Property San Antonio Texas · DSCR Loans San Antonio: Investor Financing for San Antonio Rental Properties, Airbnb, and Real Estate Investors · Investment Property Loans in San Antonio, TX: Will the Rent Cover the Payment Here?
Guides: Investment Property Cash-Out Refinance in San Antonio, TX · Investment Property Cash-Out Refinance in Texas
Brandon Miller
Founder & CEO, Mortgage Loan Originator, Lendmire LLC
- Mortgage Loan Originator · NMLS# 1129696 · Verify on NMLS Consumer Access
- North Carolina Real Estate Broker · License# 343312 · Verify on NCREC
- North Carolina Insurance Producer · License# 19053198 · Property, Casualty, Life, Health · Verify on NAIC SBS
- Lendmire LLC · Firm NMLS# 2371349 · Verify firm licensure
Required disclosures. Lendmire (NMLS# 2371349) operates as a licensed mortgage broker, not a direct lender or depository. The discussion in this article is general in nature and should not be relied upon as financial, legal, or tax advice — every investment scenario is unique and should be reviewed by a qualified professional. Any loan inquiry is subject to lender underwriting, and this article is not a commitment to lend or a guarantee of approval. Mortgage rates, loan terms, and program guidelines vary by borrower, property, and state, and may change without notice. Equal Housing Opportunity. Verify licensure at NMLS Consumer Access.