
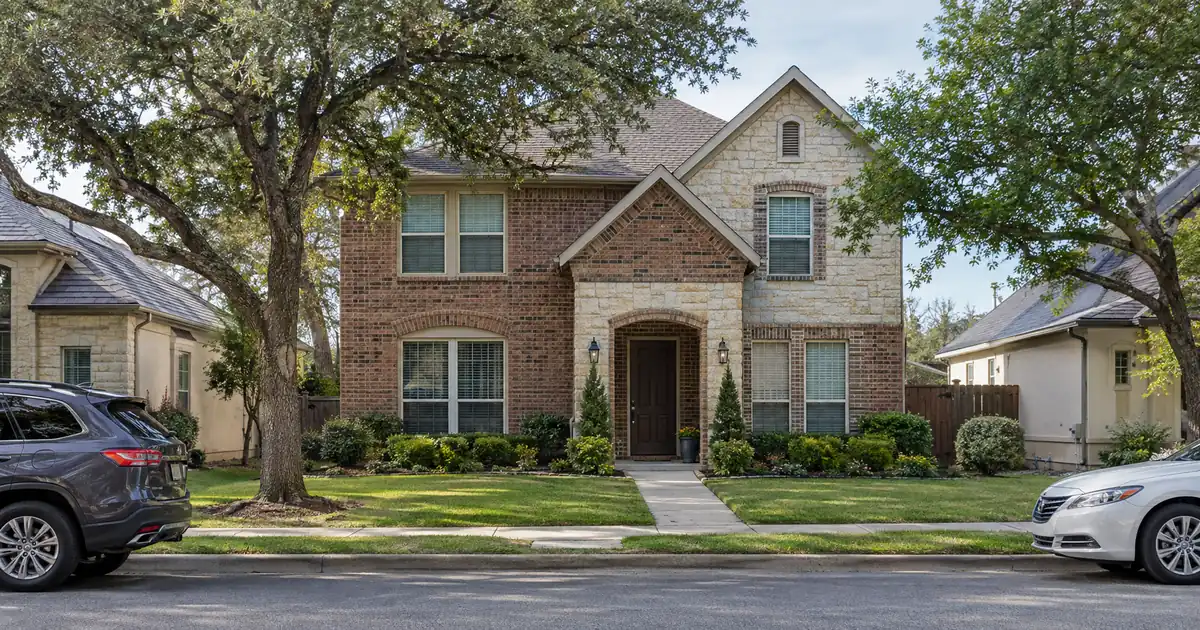
An out-of-state investor scrolling Keller listings sees what looks like a safe DFW suburb: Zillow puts the average home value at $654,648, and the values barely move. What that investor misses is the other half of the ratio. Rentometer’s average three-bedroom rent is $2,663, about 0.41% of value per month by a simple calculation (illustrative, not a published figure). For a cash-out refinance, that gap decides everything. Loan-to-value is rarely the binding constraint in Keller. Rental coverage is.
The Short Version: A cash-out refinance on a Keller, Texas rental is underwritten primarily on the property’s rental income measured against its full monthly obligation, including taxes and insurance. The 75% loan-to-value cap sets the outer limit, but coverage usually sets the real one, subject to lender guidelines.
DSCR Cash-Out Calculator
Run the cash-out numbers in Keller, TX
Rate source: Freddie Mac 30-yr average via FRED® — Federal Reserve Bank of St. Louis · effective Sep 24, 2026
Prefilled with starting assumptions — enter your property’s value, balance, taxes, and insurance for a more accurate picture.
Program parameters update from Lendmire’s centralized guideline source. Taxes and insurance are editable estimates.
As of Sep 24, 2026 · General Freddie Mac market benchmark, not a Lendmire loan offer. Property value, balance, taxes, and insurance are editable estimates. Maximum loan-to-value varies by lender, program, property type, and seasoning. Not a Loan Estimate, approval, or commitment to lend. Program availability and eligibility are subject to lender guidelines, credit approval, property review, and underwriting.
- Sources place Keller values between roughly $650K and $800K, so the same rent covers very different loan sizes.
- Modeled at full taxes and insurance, a 3BR at the citywide average rent lands well under 1.0x at 75% LTV.
- The Old Town and Keller Town Center entry band is the closest fit for coverage.
- Flat appreciation means equity comes from purchase basis and paydown, not market lift. Every figure here varies by lender and program — guidelines, property type, leverage, and credit profile all apply.
Keller Market Snapshot
A quick read on the Keller investor landscape — figures come from the cited sources below. Confirm current property-level numbers before underwriting.
| Metric | Detail |
|---|---|
| Typical rents | $1,439 average (Apartments.com Keller) |
| Employment | 24,378 employees (Zip-Codes.com, Keller) |
Why Keller Pays Poorly Per Dollar of Value
Keller is a high-price, low-yield suburb, and the sources agree on the direction even where they disagree on the level. Zillow’s index reads $654,648 with +1.3% year over year. Redfin’s housing market data shows a $655K median sale price, down 1.1%, at $240 per square foot. Movoto shows a higher median sold price of $799,250, a difference driven by listing mix and methodology. This article treats Zillow’s figure as the citywide anchor and the $650K-$800K span as the honest range.
Rents don’t scale with those prices. Rentometer’s ladder runs $1,440 for a 1BR, $1,982 for a 2BR, $2,663 for a 3BR and $3,826 for 4BR and larger. RentHop’s 3BR median is lower at $2,200, down 1.05% year over year. HAR.com cites about $3,303 for a 3BR house in ZIP 76248, though that zip’s $903,543 average price skews high. Rents are flat to slightly down.
Equity extraction here is a basis story. With value moving between -1.1% and +1.3% depending on the source, an investor who bought in a lower-priced period and paid down the balance holds most of the extractable equity. A recent buyer holds very little. Redfin’s data shows values roughly level, so a cash-out on a recent purchase largely depends on the 6-month seasoning clock and whatever value was created at acquisition.
How Coverage Sets the Cash-Out Ceiling
The 75% cash-out LTV cap is a ceiling, not a target. The lender divides rent used for lender review by the full monthly obligation (principal, interest, taxes, insurance and any HOA dues), and the standard benchmark is 1.00x. Some programs review lower ratios, but those usually require lower leverage, different pricing or more cash reserves. The guide “What Is a DSCR Loan” covers the mechanics in full.
Run the numbers on four modeled cases. These are illustrative assumptions with taxes and insurance included, not sourced market data. Rounded figures are deliberately conservative.
| Scenario (modeled) | Rent assumed | LTV | Approx. coverage |
|---|---|---|---|
| $654,648 value (Zillow average) | $2,663 | 75% | ~0.6x |
| $654,648 value | $3,303 | 75% | ~0.7x |
| $450K Old Town-band home | $2,663 | 75% | ~0.85x |
| $450K Old Town-band home | $2,663 | ~60% | ~1.0x |
The pattern is clear. At the citywide average value, a typical 3BR rent doesn’t reach 1.0x unless leverage drops to roughly one-third of value. At the Zillow average with the higher HAR rent, leverage needs to fall to about half. A $450K entry-band property reaches the benchmark near 60% LTV. That is 15 points under the cap, and the reason cash-out proceeds in Keller are usually coverage-limited.
A sub-1.00 file isn’t automatically dead. A lender may review a sub-1.00 program, lower leverage, interest-only restructuring or added reserves, but qualification stays subject to lender guidelines, credit approval and property review. Expect trade-offs in pricing and proceeds.
Working DSCR brokers see a recurring pattern in high-price, low-yield suburbs. Owners come in expecting the LTV cap to define the proceeds, then find that the appraisal’s market rent schedule and the tax-and-insurance load define them instead. The files that go smoothly usually start with a conservative rent figure and a reduced-leverage version alongside the full-cap version.
Where in Keller the Numbers Get Closest
Old Town Keller and Keller Town Center are the closest fit. Homes.com’s Keller guide says older, more modest homes start in the $300,000s, and local guides place single-family homes near the historic core at roughly $400K-$500K. Redfin’s Keller Town Center page shows a $422K median for a three-month window, down 34.6% year over year. That sample is small and volatile, so read it as directional only. Still, this is the best relative rent-to-price ratio in the city, though “best” is a low bar here.
Highland Oaks is the next step up. Homes.com puts typical homes at $500K-$600K. The same rent covers less, and the ratio worsens with each price step.
Hidden Lakes is the skip. Keller’s original master-planned community holds roughly 1,800 homes, and Homes.com shows a 12-month median of $799,995. It is owner-occupier dominated, and the price-to-rent gap is the widest in the sample. North Keller, with very large homes, is no better. Bear Creek and Marshall Ridge are worth a look mainly if an existing owner already holds property there. No reliable neighborhood-level rent data turned up, so this ranking rests on prices alone.
Duplexes Don’t Rescue the Math
Multi-unit is the usual escape from thin single-family coverage. Keller offers little of it. Asking rents near Old Town for older 2BR units run about $1,290 to $1,525 per door on Redfin’s Keller listings, which are asks, not leases. A duplex stacks to roughly $2,600-$3,000 gross, about what one single-family 3BR fetches. Multi-unit only improves coverage if the purchase price sits well below the $400K-$500K single-family band.
Purpose-built stock is also new. RentCafe reports that Keller’s apartment buildings average about 12 years old, all built since 2000, low-rise and garden-style. There is little older small multifamily to buy, which means a thin buyer pool at exit and careful comp-pulling at appraisal. Only 2,720 households are renters per RentCafe’s market data, a small minority of the city’s households. Multi-unit income stacking here is scarce, not a strong submarket.
The Competition Above the Small Rental
Newer Class A communities compete directly with a $650K house. Redfin lists Eden Keller Ranch 3BR units at $2,493 and $2,612, close to the Rentometer 3BR figure. Keller Town Center communities are also offering free-rent concessions ranging from about a month to more than two months. That caps what a landlord can charge for a smaller rental and can lengthen vacancy.
Two consequences follow. Rent upside is limited, so coverage depends on price basis and leverage, not on growth. And an appraiser’s rent schedule may land below the listing asks that owners anchor on. Luxury single-family asks vary widely and make poor comps, so a schedule can come in lower than an owner expects and trim the proceeds a coverage-based file supports. Underwrite with a vacancy cushion.
The honest read is a toss-up on the demand side. Keller is a bedroom community. Data USA puts homeownership at 83.5% and average commute at 27.4 minutes, and its leading resident sectors are Professional/Scientific/Technical (3,110 people), Manufacturing (2,959) and Finance and Insurance (2,318). Zip-Codes.com counts 2,346 business establishments employing about 24,378 people, inside a DFW metro of 7.8 million. Keller ISD is the clear local anchor employer, though no verified headcount surfaced. No university or major hospital sits in Keller, and no reliable vacancy rate was found. Demand is real but thin, and it runs on DFW’s regional job base rather than local anchors.
Seasoning, Reserves and Proceeds, Step by Step
The mechanics are worth walking through in order, because the sequence explains where Keller files stall.
1. Ownership clock. Cash-out typically requires about 6 months of ownership measured from title recording. A recent Keller purchase at market price has little equity to extract anyway, since value is flat.
2. Value. The appraisal sets value and a market rent schedule. Both matter, and the rent number is the one that surprises Keller owners.
3. Two ceilings. Proceeds run to the lesser of the 75% LTV cap and whatever balance the rent used for lender review supports at the coverage benchmark. In Keller the second ceiling usually binds first.
4. Reserves and credit. Expect about 6 months of full monthly obligation in reserves (about 9 months above $1,500,000). Credit tiers run 620, 660, 680 and 700, with 620 as the floor. Standard programs go up to $3,000,000.
5. Use of proceeds. Cash pulled out becomes the down payment on the next property, ideally in a market with better rent-to-price than Keller’s.
That last step is the actual thesis. For many Keller owners, cash-out is a way to move equity from a low-yield asset into a higher-yield one. Neighboring lower-priced areas such as Watauga and Haltom City might offer better ratios, but they weren’t researched here. Equity available is never a guaranteed figure, and program details change, so the equity-extraction mechanics and refinance details are worth reading before a file is built. The program-to-program comparison helps owners weigh a conventional refinance against coverage-based financing. Investors can also review DSCR loans in Texas for the statewide picture, and should verify current local rental rules, taxes and insurance with qualified local professionals.
DSCR vs. conventional financing
Two common ways to finance an investment property in Keller, TX. They qualify you differently — here’s how investors weigh them.
Why investors choose it
- Qualifies on the property’s rental income — no personal tax returns, W-2s, or pay stubs needed to document income.
- No personal debt-to-income ceiling to clear, so existing mortgages and obligations don’t cap your borrowing the same way.
- Can be closed in an LLC, keeping the property inside a business entity.
- Built for scaling — not held to the limit on number of financed properties that conventional financing applies.
- Underwriting centers on the deal: generally qualifies when the rent covers the payment, a 1.00x coverage ratio being a common baseline (confirmed in underwriting).
- Designed specifically for investment property, including long-term and, where the program allows, short-term rentals.
Where it’s strong
- Often the lowest ongoing financing cost for a buyer who fully qualifies on personal income — a fit for a first property or a cost-first purchase.
Trade-offs for investors
- Requires full personal income documentation and must fit within a debt-to-income limit — salary, existing debts, and other mortgages all count.
- Typically held in your personal name rather than a business entity.
- Caps how many financed properties you can carry, which can become a ceiling as a portfolio grows.
- Evaluates you as a borrower as much as the property, which usually means more paperwork.
How investors usually choose: a first or single property often optimizes for the lowest financing cost; portfolio builders often optimize for leverage, vesting in an LLC, and scaling past conventional caps. The right answer depends on your goals, the property, and current guidelines — both paths run through select lenders in Lendmire’s wholesale network, with eligibility and terms confirmed in underwriting.
Frequently Asked Questions
How do you qualify for a DSCR cash-out refinance in Keller, Texas?
The property’s rent used for lender review has to cover its full monthly obligation, typically at a 1.00x benchmark, with about 6 months of seasoning, reserves of about 6 months and a credit score of at least 620. In Keller, the rent side is the hard part because values run high against rents. Final eligibility depends on lender guidelines, property review and credit approval.
What are the requirements for an investment property loan in Keller, Texas?
Programs generally look at credit tier (620 to 700), the coverage ratio, reserves and leverage, with cash-out capped at 75% LTV. Loan amounts run up to $3,000,000 on standard programs. Keller’s price levels mean a lot of files land in reduced-leverage territory to reach the benchmark. Details vary by borrower, property and lender.
How much equity can a Keller investor realistically pull out when rents run thin?
Less than the LTV cap suggests. Modeled with full taxes and insurance, a $450K property at the average 3BR rent reaches about 1.0x near 60% LTV, and a $654,648 property needs far lower leverage. The ratio, not the 75% cap, usually sets the ceiling. A calculator run with your actual rent and balance gives the real answer.
Does flat home value change how a Keller cash-out works?
Yes. Zillow shows +1.3% and Redfin -1.1%, so recent appreciation adds little. Proceeds depend on how far below current value your loan balance sits, which favors long-time owners and disadvantages recent buyers. The seasoning clock still applies regardless of value trend.
So What Does Your Basis Look Like?
Keller rewards the owner who bought low, paid down and holds a property in the Old Town price band, and it punishes the one relying on appreciation or recent-purchase equity. Before any file gets built, the useful exercise is simple: if the appraisal’s rent schedule came in at the citywide 3BR average, what leverage would your Keller property actually support?
For current guidelines and terms, see Lendmire’s DSCR loan programs page.
About Lendmire
Lendmire (NMLS# 2371349) is a DSCR-focused mortgage broker that helps arrange investor financing across 41 markets, including Washington, D.C., through wholesale and investor-lending channels. DSCR eligibility is generally reviewed by the lender on the property’s rental income rather than personal income documentation, subject to lender guidelines, which works for self-employed investors, LLC operators and portfolios above four financed properties. Scotsman Guide named Lendmire a Top Mortgage Workplace in both 2025 and 2026.
Get Started
Ready to find the right loan for you?
In about 30 seconds you can review financing options available for your investment property. No commitment required.
Informational only. Not a Loan Estimate, approval, or commitment to lend. Program availability and eligibility are subject to lender guidelines, credit approval, property review, and underwriting.
References
1. Zillow Home Value Index, Keller
5. Redfin, Keller housing market
7. HAR.com
9. Homes.com
11. RentCafe reports
12. RentCafe, Keller
13. Data USA, Keller
14. Keller ISD
15. 2025
16. 2026
This article is part of Lendmire’s investment property cash-out refinance program — full qualification details, guidelines, and scenarios live on the program page.
Related reading: DSCR Cash Out Refinance Keller Texas: How Investors Access Equity Without Income Docs · Cash Out Refinance Investment Property Haltom City Texas · Cash Out Refinance Investment Property in Benbrook TX
Guides: Investment Property Cash-Out Refinance in Texas
Brandon Miller
Founder & CEO, Mortgage Loan Originator, Lendmire LLC
- Mortgage Loan Originator · NMLS# 1129696 · Verify on NMLS Consumer Access
- North Carolina Real Estate Broker · License# 343312 · Verify on NCREC
- North Carolina Insurance Producer · License# 19053198 · Property, Casualty, Life, Health · Verify on NAIC SBS
- Lendmire LLC · Firm NMLS# 2371349 · Verify firm licensure
Legal disclosures. Lendmire (NMLS# 2371349) is a state-licensed mortgage brokerage that arranges financing through wholesale lender relationships. Lendmire is not a direct lender, depository institution, or registered financial advisor. The discussion above is general informational content about real estate financing — it is not financial, legal, or tax advice, and readers should consult licensed professionals for guidance on their individual circumstances. Loan inquiries are subject to lender underwriting; this article does not represent a commitment to lend. Loan terms, rates, and qualification standards vary by borrower, property, and state, and are subject to change at any time. Equal Housing Opportunity. NMLS Consumer Access: nmlsconsumeraccess.org.