
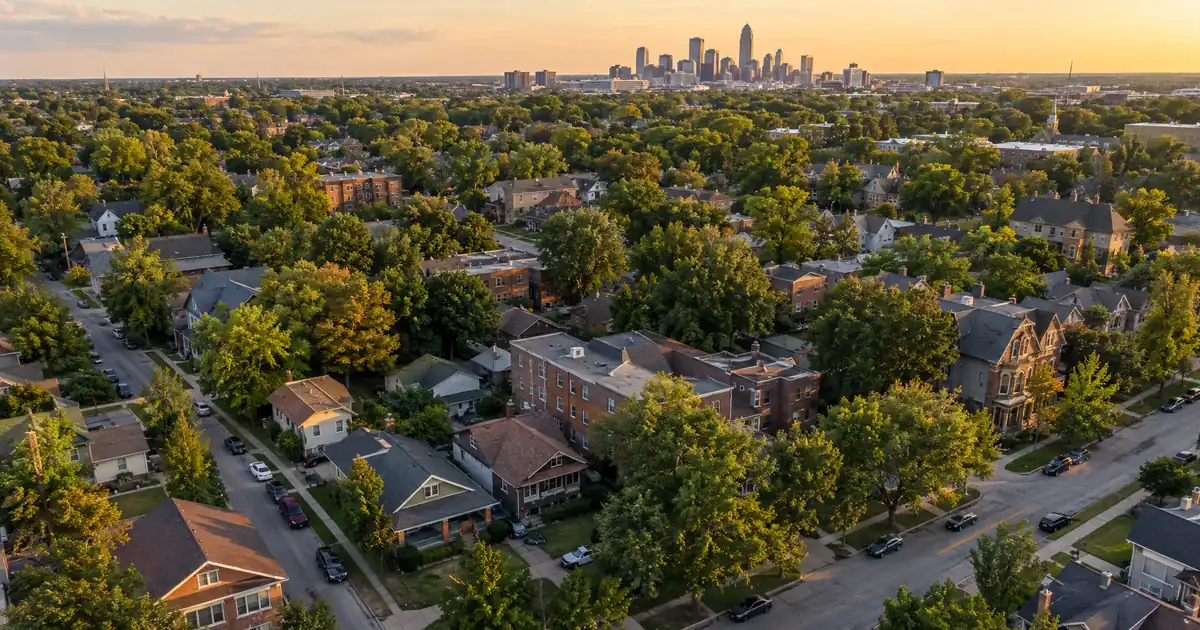
Marion County and its five largest neighbors added an estimated 104,000 residents over the past several years, 57% of Indiana’s total gain, according to the Indiana Capital Chronicle’s read of Census estimates. That is real tenant demand. It has not produced real price momentum. Citywide sale prices are close to flat and homes sit longer, so for an owner planning a cash-out refinance, the equity has to come from the basis and the work done on the property. Market lift is not going to supply it.
DSCR Cash-Out Calculator
Run the cash-out numbers in Indianapolis, IN
Rate source: Freddie Mac 30-yr average via FRED® — Federal Reserve Bank of St. Louis · effective Sep 24, 2026
Prefilled with starting assumptions — enter your property’s value, balance, taxes, and insurance for a more accurate picture.
Program parameters update from Lendmire’s centralized guideline source. Taxes and insurance are editable estimates.
As of Sep 24, 2026 · General Freddie Mac market benchmark, not a Lendmire loan offer. Property value, balance, taxes, and insurance are editable estimates. Maximum loan-to-value varies by lender, program, property type, and seasoning. Not a Loan Estimate, approval, or commitment to lend. Program availability and eligibility are subject to lender guidelines, credit approval, property review, and underwriting.
The Quick Read:
A DSCR cash-out refinance in Indianapolis, Indiana is underwritten primarily on the property’s rental income measured against its full monthly obligation, rather than on the borrower’s personal income. Lender requirements such as ownership seasoning, the appraisal, and reserves documentation shape the file, while the program’s LTV ceiling sets the maximum draw and the appraised value, not market momentum, determines how much equity exists.
- Median days on market roughly doubled in the latest reading, 55 versus 27 a year earlier.
- Bates-Hendricks renovated single-family homes commonly rent for $1,600–$1,900 against a roughly $225,000 average price.
- Near Eastside duplexes model near 1.15x on full PITIA; Greenwood single-family models well under 1.00x.
- Cash-out needs about 6 months of ownership from title recording.
Through Lendmire’s DSCR program footprint — 41 markets, including Washington, D.C. — lenders may review qualifying rental income subject to program guidelines for Indianapolis, Indiana investors. Lendmire (NMLS# 2371349) is a DSCR-focused mortgage broker. It arranges these loans through wholesale lenders, and the lenders decide eligibility. Unlike some larger non-QM lenders that treat investor loans as a side product, the brokerage works investor files as its main business. That matters on a cash-out, where the file is mostly documentation.
Indianapolis Market Snapshot
A quick read on the Indianapolis investor landscape — figures come from the cited sources below. Confirm current property-level numbers before underwriting.
| Metric | Detail |
|---|---|
| Recent appreciation | Metro +1.9% (Living in Indianapolis) |
| University enrollment | 20,677 students (IU News (enrollment)) |
| Vacancy | 6.9% (WareCRE Q1 2026) |
Flat Prices, Longer Days: What the Appraiser Sees
The appraiser sees a flat market in Indianapolis. Redfin’s median sale price, relayed by Propcash, sat at $245,123, up 0.05% year over year. Median days on market went from 27 to 55. Downtown is softer: Redfin’s downtown data shows a $400K median, down 0.035%, with homes taking 65 days to sell versus 25.
Underwrite the refinance at roughly today’s value. Don’t build the cash-out on next year’s appreciation.
The spread between submarkets is the more useful number. Downtown sold near $360,000 in one monthly reading while West Indianapolis sat near $134,000. North of the city, Hamilton County reached a $500,000 median, up 4.2% against 1.9% for the broader metro. Hamilton County is where appreciation lives. It is also where the basis is too high for rent to cover the debt. The low-basis west, south and east sides run the other way: decent coverage, little lift. So cash-out equity on those properties comes from forced value, meaning rehab, lease-up or stabilization.
Forced Value Is the Equity Source
Forced value is where most Indianapolis cash-out equity comes from. The property was bought below stabilized value, the work is finished, tenants are in place, and the appraisal captures the gap. The DSCR refinance then turns that gap into capital for the next acquisition, capped by the 75% LTV ceiling and subject to lender guidelines.
Picture an investor who bought a dated house in Bates-Hendricks, finished a renovation, and leased it. The basis was low, the appraisal comes in near the neighborhood average, and the borrower is drawing against value created, not value found. Now picture the same investor who paid retail for a finished house. There is almost nothing to draw. Flat comps and slower sales leave no cushion for that file.
The mechanics sit on the equity-extraction mechanics page, and the broader refinance side covers rate-and-term alternatives. The Indiana-specific program view is at Indiana DSCR investor loans.
Where the Coverage Holds: Three Submarkets
The Near Eastside, Bates-Hendricks and the Perry Township side of the south end are where rent covers the debt with room left for reserves. Fountain Square and Broad Ripple are good neighborhoods with thinner math. Neighborhood figures below come from local brokerage blogs, which are secondary sources, so treat them as directional.
| Submarket | Price anchor | Rent anchor | Coverage read |
|---|---|---|---|
| Near Eastside | $160K–$230K | No sourced figure | Duplex-driven, near 1.15x |
| Bates-Hendricks | ~$225K average | $1,600–$1,900 renovated SFR | Low 1.2x to ~1.4x |
| Fountain Square | $285K–$320K | No sourced figure | Thinner |
| Greenwood (suburb) | ~$319,732 value | ~$1,385 average | Well under 1.00x |
Bates-Hendricks. The price comes from Roots Realty’s neighborhood write-up and the rent range from Roots’ rental-market report. The modeled coverage below uses those inputs as assumptions. At a $225,000 appraised value and a 75% LTV refinance, rent of $1,600 covers full PITIA, including taxes and insurance, at about 1.2x. At $1,900 it approaches 1.4x. That clears the 1.00x baseline with room for a vacancy haircut. Renovated stock with documented rent is the cleanest refinance candidate in the city. Exact terms depend on the lender’s guidelines, property type, leverage, and a full review of the borrower’s file.
Near Eastside. Roots reports prices frequently running $160,000–$230,000, well below the Indianapolis average, in a historic, transitioning area close to downtown and Irvington. Redfin’s Near Eastside page shows multi-family inventory, which points to duplexes. Listing-level rents there are anecdotal, with one duplex showing tenants at about $800 a side, so treat that as a modeling input and not a market figure. Model a duplex at a $230,000 appraised value, $1,600 total rent and 75% LTV. Coverage lands near 1.15x including taxes and insurance. That is workable but not wide. Two rent streams against one price is what makes small multifamily clear where a single house at the same rent might not. Still, a one-unit vacancy on a duplex moves the ratio fast. Every figure here varies by lender and program — guidelines, property type, leverage, and credit profile all apply.
Perry Township and the south end. The University of Indianapolis sits here. Older township-level figures put it as a low-basis, higher-yield tier of workforce and student-adjacent tenants. Those numbers are dated, so they are not quoted here. Pull current comps before relying on the tier.
Skip the Suburbs for Cash-Out Math.
Greenwood and Carmel don’t pencil. Greenwood’s Zillow value is about $319,732 and its average rent about $1,385, both per a local brokerage blog that itself calls the rental economics not especially compelling. Modeled at 75% LTV on full PITIA, that pair sits around 0.7x. Carmel’s median near $447,500, per iBuyer.com, is worse. Final terms depend on lender guidelines, property type, leverage, and the borrower’s complete credit picture.
A sub-1.00 file is not dead, but it changes the conversation. A lender may review a sub-1.00 program, an interest-only structure, or a lower LTV, typically with stronger compensating factors such as credit profile and reserves. Pricing and leverage usually differ from a 1.00x-plus file. Qualification stays subject to lender guidelines, credit approval and property review. Most Indianapolis investors holding north-side properties would do better selling than refinancing for cash flow.
What Changes Over the Next 6 to 24 Months?
Supply is the variable that moves the Indianapolis thesis. The data conflicts, and both sides belong in the file.
The bearish read: Apartments.com, citing CoStar, describes a supply wave that crested in mid-2024, with vacancy projected at 11.8% and annual rent growth of 0.8%. The bullish read: Marcus & Millichap says this year’s deliveries are down 55% from the peak. The Kirkland Company expects vacancy to compress gradually over the next 12 to 24 months. Walker & Dunlop, an advisory firm with its own interest in the story, cites roughly a 65% decline in new supply and rent growth ahead of the national average. A broader Roots rental report puts metro vacancy near 6%, average rents around $1,300–$1,350, and growth of roughly 2–3.5%. RentCafe shows a $1,268 citywide average with 44% of households renting. These specifics are subject to lender guidelines and a full review of property, leverage, and credit.
The gap between 11.8% and 6% is mostly scope. One figure tracks large apartment stock, the other a broader mix. Much of the new supply is in the growth suburbs, not the urban core where small rentals compete.
(Concessions at new complexes still pull on nearby small-unit rents, so haircut rent assumptions.) A falling pipeline supports timing a refinance toward later in the cycle, once leases are seasoned and the appraiser has stabilized comps. Indicators to watch:
- Median days on market, which has roughly doubled
- Quarterly apartment vacancy against delivery counts
- Rent growth on renewed leases, not just new ones
- Appraisal comps within the same neighborhood
The Demand Base Under the Numbers
Employment anchors explain why the tenant pool holds even with flat prices. Indy Today reports trade, transportation and utilities at 246,100 jobs, education and health services at 191,000, and professional and business services at 184,400. Eli Lilly is headquartered here with more than 10,000 local employees, and a large regional health system runs the largest physician network in the state. IU Indianapolis enrolled 20,677 students, per IU News. Looking forward, the Indiana Business Research Center’s forecast cites Lilly’s LEAP district and Boone County manufacturing at $13 billion, plus a $200 million Elanco headquarters. That build-out pulls growth toward the metro fringe. It supports workforce rental demand without lifting core-neighborhood values much.
Healthcare and life sciences give the market a steadier base than most Midwest capitals of its size. That shows up in lease renewals, not in appraisal values.
Seasoning, Reserves and the File
Cash-out on a recent purchase waits on seasoning of about 6 months, measured from title recording and documented by the settlement statement. Files that assume it away get kicked back. Reserves typically run about 6 months of PITIA, and about 9 months above $1,500,000. Credit tiers generally run 620, 660, 680 and 700, with 620 as the floor. The LTV ceiling is 75% on cash-out, and loan amounts go up to $3,000,000 on standard programs, subject to lender guidelines. Equity available depends on rent used for lender review, PITIA, reserves and that ceiling. It is not a guaranteed figure.
In markets like this one, the common friction point is rent evidence on recently finished rehabs. Leases signed the month before the appraisal, or rents quoted from a listing and not a lease, leave the coverage number resting on an assumption. The cleaner files tend to carry a signed lease, a rent roll for the small multifamily, entity documents that match the vesting on the deed, and a reserves statement that’s current. On the rehab files, the renovation scope and paid invoices help the appraiser explain the value step-up. Entity-owned properties are handled subject to lender program eligibility. A DSCR loan treats the property’s own rent as the income, which is why the lease packet is the file. The key differences from a conventional cash-out show up mostly in the documents.
Unigov and the Appraisal Comp Problem
Indianapolis is Indiana’s only consolidated city-county. The Abell Foundation notes it was the only major post-war consolidation accomplished without a voter referendum. For investors, the practical effect is that “Indianapolis” covers all of Marion County. Near Eastside, Speedway, Perry Township and downtown sit under one label with very different price levels.
That matters on appraisal day. An appraiser pulling comps from the wrong township can miss the value by a wide margin. Appraisal reconsideration is a routine step here, and a packet with recent same-neighborhood sales and renovation documentation usually does the work. Send it with the original file, not after a short value lands.
Speedway, Mars Hill and Eagledale on the west side are flagged by Roots as cash-flow areas, but no sourced rents or prices exist for them, so they belong on a watch list, not in a model. Verify current local rules, taxes and insurance with qualified local professionals before committing to any submarket.
The Plain Read
Buy cheap, fix it, lease it, season it, refinance it, and don’t count on the market to do any of it for you. A local appraiser would say the same thing: Indianapolis rewards the investor who can show leases and invoices, and it doesn’t reward the one who bought at retail and waited.
Frequently Asked Questions
How long do I have to own an Indianapolis rental before a cash-out refinance?
About 6 months, measured from title recording and documented by the settlement statement. A recent purchase with a rehab is the common case here. The loan amount still depends on the appraised value, the 75% LTV ceiling and reserves, all subject to lender guidelines.
Does flat appreciation make a cash-out refinance pointless?
No, but it shifts where the equity comes from. With the citywide median up only 0.05% and days on market doubled, the draw depends on purchase-plus-rehab basis against the appraised value. Properties bought below stabilized value still produce a gap, and properties bought at retail usually don’t.
DSCR vs. conventional financing
There are two common ways to finance an investment property in Indianapolis, IN, and they qualify you differently — here’s how investors weigh them.
Why investors choose it
- Qualifies on the property’s rental income — no personal tax returns, W-2s, or pay stubs needed to document income.
- No personal debt-to-income ceiling to clear, so existing mortgages and obligations don’t cap your borrowing the same way.
- Can be closed in an LLC, keeping the property inside a business entity.
- Built for scaling — not held to the limit on number of financed properties that conventional financing applies.
- Underwriting centers on the deal: generally qualifies when the rent covers the payment, a 1.00x coverage ratio being a common baseline (confirmed in underwriting).
- Designed specifically for investment property, including long-term and, where the program allows, short-term rentals.
Where it’s strong
- Often the lowest ongoing financing cost for a buyer who fully qualifies on personal income — a fit for a first property or a cost-first purchase.
Trade-offs for investors
- Requires full personal income documentation and must fit within a debt-to-income limit — salary, existing debts, and other mortgages all count.
- Typically held in your personal name rather than a business entity.
- Caps how many financed properties you can carry, which can become a ceiling as a portfolio grows.
- Evaluates you as a borrower as much as the property, which usually means more paperwork.
How investors usually choose: a first or single property often optimizes for the lowest financing cost; portfolio builders often optimize for leverage, vesting in an LLC, and scaling past conventional caps. The right answer depends on your goals, the property, and current guidelines — both paths run through select lenders in Lendmire’s wholesale network, with eligibility and terms confirmed in underwriting.
What coverage should an Indianapolis duplex show?
Modeled at a $230,000 appraised value, $1,600 total rent and 75% LTV, a Near Eastside duplex lands near 1.15x on full PITIA including taxes and insurance. That clears a 1.00x baseline but leaves little room for a vacant unit. Actual results depend on the lease, the appraisal and lender guidelines. Terms vary by lender guidelines, property type, leverage, credit profile, and full file review.
Does Unigov change how an appraiser values my property?
It changes the comp pool. Indianapolis covers all of Marion County, so comps have to come from the same township and neighborhood or the value can land well off. A reconsideration packet with same-area sales is the standard fix.
Does high apartment vacancy hurt small rentals?
Yes, it can. Concessions at large complexes put pressure on nearby small-unit rents, and some projections show vacancy at large-scale properties running elevated. Broader reports put metro-wide vacancy noticeably lower, and supply deliveries are falling. Haircut the rent assumption in the coverage math and lean on signed leases.
For current guidelines and terms, see Lendmire’s DSCR loan programs page.
About Lendmire
A non-QM mortgage broker (NMLS# 2371349), Lendmire arranges DSCR financing for real estate investors in 41 markets: 40 states plus Washington, D.C. Because deals are underwritten primarily on property cash flow rather than personal income documentation, the structure suits self-employed buyers and entity-owned portfolios. Lendmire places loans through wholesale investor lenders and is not a direct lender. It has been recognized as a 2026 Scotsman Guide Top Workplace and a 2025 Scotsman Guide Top Workplace. Investors can reach the team at 828-256-2183.
Get Started
Ready to find the right loan for you?
In about 30 seconds you can review financing options available for your investment property. No commitment required.
Informational only. Not a Loan Estimate, approval, or commitment to lend. Program availability and eligibility are subject to lender guidelines, credit approval, property review, and underwriting.
References
2. propcash.co — Indiana Indianapolis Housing Market 2026
3. Roots Realty, Indianapolis rental market
4. Hamilton County reached a $500,000 median
5. IU News, IU Indianapolis enrollment
7. Redfin, Downtown Indianapolis
8. Roots Realty’s neighborhood write-up
10. University of Indianapolis
11. Livinginindianapolis.com — Best Areas to Live IN Indianapolis Roi
12. Ibuyer.com — Best Neighborhoods IN Indianapolis
13. Apartments.com, citing CoStar
16. RentCafe
17. Indy Today
18. Eli Lilly
19. IU Indianapolis
20. Indiana Business Research Center’s forecast
21. Encyclopedia of Indianapolis, Structure of Unigov
22. Abell Foundation
23. a 2026 Scotsman Guide Top Workplace
24. a 2025 Scotsman Guide Top Workplace
This article is part of Lendmire’s investment property cash-out refinance program — full qualification details, guidelines, and scenarios live on the program page.
Related reading: Luxury Rental DSCR Loans In New Jersey · Jersey Shore Vacation Rental Loans: DSCR Financing In Ocean City, Cape May And Long Beach Island · DSCR Cash-out Refinance In New Jersey: Pulling Equity From A Rental
Guides: Investment Property Cash-Out Refinance in Indianapolis, IN · Investment Property Cash-Out Refinance in Indiana
Brandon Miller
Founder & CEO, Mortgage Loan Originator, Lendmire LLC
- Mortgage Loan Originator · NMLS# 1129696 · Verify on NMLS Consumer Access
- North Carolina Real Estate Broker · License# 343312 · Verify on NCREC
- North Carolina Insurance Producer · License# 19053198 · Property, Casualty, Life, Health · Verify on NAIC SBS
- Lendmire LLC · Firm NMLS# 2371349 · Verify firm licensure
Disclosures. The information presented in this article is general market commentary, not financial, legal, or tax advice. Lendmire is a mortgage brokerage (NMLS# 2371349) — not a direct lender or depository institution — and loan placement is subject to lender underwriting. Nothing in this content represents a commitment to lend. Loan terms, pricing, and program availability vary based on borrower qualifications, property characteristics, and state of subject property, and are subject to change at any time. Lendmire complies with Equal Housing Opportunity requirements. Consumer access: nmlsconsumeraccess.org.