
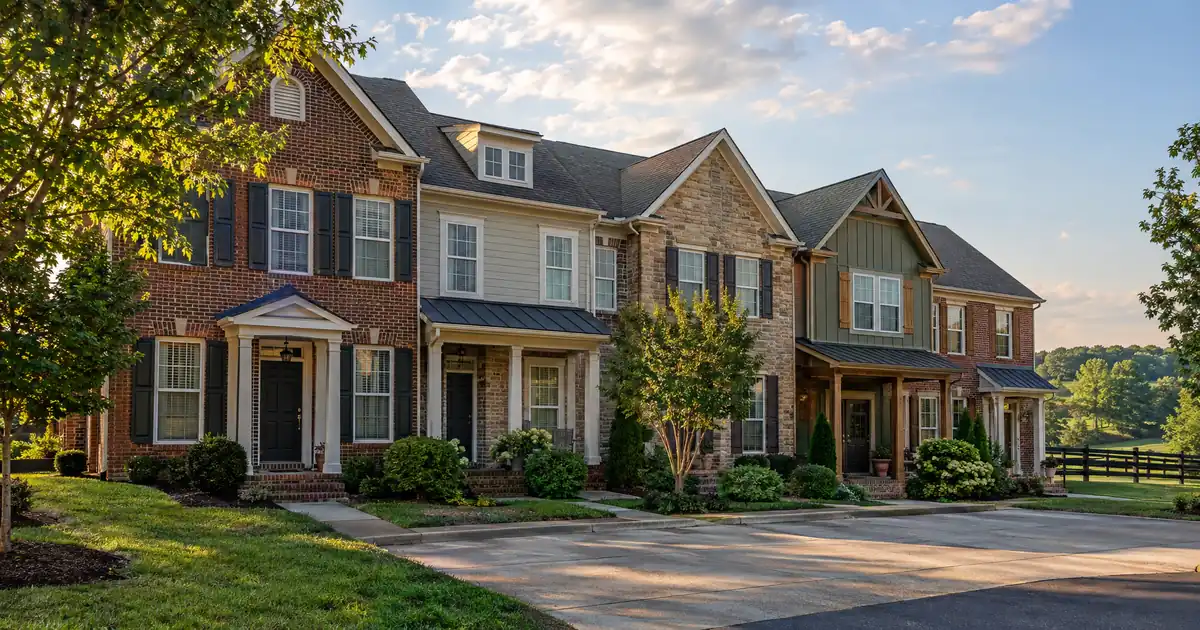
City Center, the 40299 core near Gaslight Square, is where a Jeffersontown cash-out plan gets uncomfortable. NeighborhoodScout models a median price of $341,597 against an average rent of $1,723 there. Those are modeled estimates, not closed comps. Even so, the gap between price and rent tells an owner what to expect. Pull equity at the maximum allowed leverage, and the coverage number, not the appraisal, is likely to be the constraint. This piece is for investors who already own in Jeffersontown and want to recycle equity, and it starts with that constraint.
DSCR Cash-Out Calculator
Run the cash-out numbers in Jeffersontown, KY
Rate source: Freddie Mac 30-yr average via FRED® — Federal Reserve Bank of St. Louis · effective Sep 24, 2026
Prefilled with starting assumptions — enter your property’s value, balance, taxes, and insurance for a more accurate picture.
Program parameters update from Lendmire’s centralized guideline source. Taxes and insurance are editable estimates.
As of Sep 24, 2026 · General Freddie Mac market benchmark, not a Lendmire loan offer. Property value, balance, taxes, and insurance are editable estimates. Maximum loan-to-value varies by lender, program, property type, and seasoning. Not a Loan Estimate, approval, or commitment to lend. Program availability and eligibility are subject to lender guidelines, credit approval, property review, and underwriting.
Key Takeaways:
A cash-out refinance on a Jeffersontown, Kentucky rental is underwritten primarily on the property’s rental income measured against its full monthly obligation. The file works only when rent used for lender review covers principal, interest, taxes, and insurance at a leverage level the lender permits, and the 75% ceiling is a limit, not a target.
- Median sale price is $310K, but Redfin shows price per square foot down 3.3%. Don’t lean on appreciation.
- Modeled coverage on median-priced houses falls below 1.0x at 75% LTV once taxes and insurance are included.
- Cash-out generally needs about 6 months of ownership from title recording, plus roughly 6 months of PITIA in reserves.
- Jobs outnumber residents, so tenant demand is solid. Yield is the weak leg.
Jeffersontown Market Snapshot
A quick read on the Jeffersontown investor landscape — figures come from the cited sources below. Confirm current property-level numbers before underwriting.
| Metric | Detail |
|---|---|
| Home prices | $327,734 median value (NeighborhoodScout) |
| Typical rents | $1,723 (NeighborhoodScout City Center) |
| Employment | 25,650 employees (City of Jeffersontown, Business) |
The Math Underneath the 75% Ceiling
Most cash-out files in Jeffersontown will not clear 1.0x at maximum leverage. That is the main finding. The standard benchmark is a 1.00x coverage ratio, where rent used for lender review equals the full monthly obligation. Lender guidelines, credit profile, reserves, and property review all shape what gets approved. Some programs will review lower coverage with compensating factors.
Run the numbers on a house near the citywide median. Redfin shows a $310K median sale price over the three months through May. For rent, use the $1,324 single-family median from Homes.com. Modeled with Kentucky-average taxes and insurance and a standard financing assumption, coverage at 75% LTV lands around 0.7x. Those inputs are modeled assumptions, not sourced market facts. Cutting leverage to roughly half of value gets the ratio near 1.0x. Terms vary by lender guidelines, property type, leverage, credit profile, and full file review.
Now the City Center estimate: a $341,597 price and $1,723 rent. At 75% LTV, coverage still rounds down to the mid-0.8s including taxes and insurance. The file gets close to 1.0x at around 60% LTV or lower. City Center rents are the strongest data point here, and even they don’t carry maximum leverage. Exact terms depend on the lender’s guidelines, property type, leverage, and a full review of the borrower’s file.
If the number falls short, the paths a lender might review are:
- A sub-1.00 program, which usually means lower leverage, stronger credit, and more reserves.
- An interest-only structure.
- A partial paydown at closing that changes the loan size.
Each carries a cost, and none is a promise of approval. The pattern is a price-to-rent ratio of 15.7, meaning moderate rent relative to value.
Skip the Appreciation Story
Redfin’s headline reads well: median sale price up 4.1% year over year. Its price per square foot tells a different story, at $173 and down 3.3%. The two figures point in opposite directions, which suggests the price gain reflects a shift toward larger homes rather than true appreciation. Appraisers work from comparable sales and price per square foot, so don’t underwrite a cash-out on a 4% appreciation assumption.
The market is also slowing. Homes now sit an average of 37 days on the market versus 21 a year earlier, and 92 homes sold in May versus 103. Movoto shows a similar pattern, at 37 days versus 13. For an owner who renovated to force value, this matters. A longer marketing period and flat price per square foot make the pro forma harder to defend. Set the cash-out against today’s likely appraised value, not the after-repair story.
Working DSCR brokers see a recurring pattern in mid-priced suburban markets like this one: the appraisal comes in near the owner’s expectation, but the coverage math sets the ceiling well below the LTV cap. Owners tend to plan around the 75% figure and discover afterward that rent used for lender review, not value, decides the loan size. Run the coverage number before ordering anything.
Seasoning is the easier part. Cash-out typically requires about 6 months of ownership measured from title recording. Reserves generally run about 6 months of PITIA, subject to lender guidelines. An owner who bought, renovated, and refinanced inside that window should confirm the recording date first.
Why Demand Isn’t the Problem
Tenant demand in Jeffersontown comes from jobs, not a single campus or base. The City of Jeffersontown reports over 1,700 businesses employing over 25,650 people. The city describes Bluegrass Commerce Park as the largest diversified employment center in Kentucky, with 38% of city land zoned for business. (Wikipedia cites a much higher headcount for the park, so treat any single employment figure as an attributed claim.) The Lane Report notes the roughly 10-square-mile city employs more people than live in it.
The mix is broad. Data USA shows health care and social assistance as the largest industry among residents, with 2,186 workers, followed by manufacturing at 1,467. Median household income is $78,185. One Louisville lists Baptist Health, ADP, Amgen, Delta Dental, Lantech, and Signature Healthcare among the largest employers. That diversification supports steady long-term renting. It does not lift rent-to-value.
A job base that supports demand doesn’t make a low-yield rental cash-flow well. Lenders and tenants can both be comfortable while the coverage ratio still says no.
Neighborhoods That Get Named (and What They Don’t Tell You)
Homes.com lists Hikes Point, Buechel, Bon Air, Springlee, and Lake Forest Beckley as popular single-family rental areas. The research behind this article found no per-neighborhood prices, rents, or tenant profiles, and none are invented here. The area names show where single-family rental activity is visible. They don’t show which one pencils best.
Housing type is the more useful variable. NeighborhoodScout reports 68.24% single-family detached, 16.82% large apartment complexes, 8.72% duplexes and small buildings, and 6.12% attached homes. RentCafe shows 30% of housing is renter-occupied, and of rentals, 72% are in complexes under 50 units and 23% are single-family.
The single-family owner competes with a familiar product. The small multifamily owner holds a scarce one. Duplexes through fourplexes are under 9% of stock, and two units under one roof generally carry the payment better than one. If the plan for the proceeds is a small multifamily purchase, scarcity works in your favor on rent and against you on finding inventory.
Which Rent Number Do You Use?
Rent sources disagree here, and the choice can decide the loan. Apartments.com shows an average of $1,083 but a three-bedroom average of $1,567. Homes.com shows the $1,324 single-family median. Zumper shows a lower figure, $1,102, with limited data. The apartment averages lean toward smaller units.
Underwrite the specific house on its own rent comps and, where a lender requires it, a rental appraisal. Assuming a $1,083 rent versus a $1,567 rent swings coverage by several tenths of a point. The gap between those two numbers is bigger than any rounding in the loan structure.
This is a toss-up worth stress-testing: a three-bedroom near the Commerce Park corridor might support the higher range, but treat the low end as the floor until a comp says otherwise.
Where Conventional Beats DSCR
DSCR isn’t automatically the right lane here. Where DSCR and conventional diverge depends on the borrower. A W-2 investor with a strong personal income and only one or two financed properties may find conventional cash-out cheaper, and personal income can carry a file that rental income can’t. That matters in Jeffersontown, where thin rent-to-value pushes coverage below the benchmark.
The flip point comes with volume or structure. Once a portfolio passes four financed properties, or the property sits in an LLC (subject to lender program eligibility), conventional runs out and DSCR becomes the practical option. Self-employed owners whose traditional personal-income documentation understates income are in a similar position. Understanding how DSCR coverage is calculated helps you see quickly which side of that line you’re on.
What Are You Buying With the Proceeds?
Cash-out only helps if the next deal covers its own debt. Pulling equity to buy another single-family rental at a similar price-to-rent ratio copies the same tight coverage into a second property. The stronger move might be deploying proceeds into small multifamily, where rent per unit can carry the payment better, or into a lower-priced house where rent-to-value is higher.
Consider an owner who holds a paid-down house at the citywide median and refinances to 75% LTV. If sub-1.00 coverage limits the loan to a lower percentage, the proceeds shrink and so does the down payment on the next property. Take the opposite view: a lower-leverage cash-out that still funds a better-yielding acquisition may beat a maximum-leverage draw that funds a weak one. The cash-out refinance program page walks through the mechanics. Investors weighing structures can review DSCR loan options for Kentucky investors or pull a DSCR quote, or call Lendmire at 828-256-2183. Verify current local rental rules, taxes, and insurance with qualified local professionals before committing. Review details remain subject to lender overlays. Every figure here varies by lender and program — guidelines, property type, leverage, and credit profile all apply.
DSCR vs. conventional financing
Two common ways to finance an investment property in Jeffersontown, KY. They qualify you differently — here’s how investors weigh them.
Why investors choose it
- Qualifies on the property’s rental income — no personal tax returns, W-2s, or pay stubs needed to document income.
- No personal debt-to-income ceiling to clear, so existing mortgages and obligations don’t cap your borrowing the same way.
- Can be closed in an LLC, keeping the property inside a business entity.
- Built for scaling — not held to the limit on number of financed properties that conventional financing applies.
- Underwriting centers on the deal: generally qualifies when the rent covers the payment, a 1.00x coverage ratio being a common baseline (confirmed in underwriting).
- Designed specifically for investment property, including long-term and, where the program allows, short-term rentals.
Where it’s strong
- Often the lowest ongoing financing cost for a buyer who fully qualifies on personal income — a fit for a first property or a cost-first purchase.
Trade-offs for investors
- Requires full personal income documentation and must fit within a debt-to-income limit — salary, existing debts, and other mortgages all count.
- Typically held in your personal name rather than a business entity.
- Caps how many financed properties you can carry, which can become a ceiling as a portfolio grows.
- Evaluates you as a borrower as much as the property, which usually means more paperwork.
How investors usually choose: a first or single property often optimizes for the lowest financing cost; portfolio builders often optimize for leverage, vesting in an LLC, and scaling past conventional caps. The right answer depends on your goals, the property, and current guidelines — both paths run through select lenders in Lendmire’s wholesale network, with eligibility and terms confirmed in underwriting.
Frequently Asked Questions
Can a Jeffersontown rental reach 75% LTV on a cash-out?
75% is the ceiling, not the expectation. At median prices and typical rents, coverage tends to fall below 1.0x at that leverage once taxes and insurance are included. Lower LTV, a stronger rent comp, or a sub-1.00 program review are the usual paths, subject to lender guidelines.
How long do I have to own the property before a cash-out?
About 6 months, measured from the date title was recorded. Plan reserves of roughly 6 months of PITIA as well. Both are guideline figures that vary by lender and loan scenario.
Which Jeffersontown rent figure should I use?
Use the rent comp for your specific house, not a citywide average. Published figures range from $1,083 to $1,567 across sources, and the single-family median is $1,324. The wrong assumption can flip coverage from passing to failing.
Does the Bluegrass Commerce Park headcount matter to a lender?
It supports the demand argument, but sources disagree on the number. The city cites over 25,650 employees citywide, while other sources cite a higher figure for the park alone. Attribute whichever you use. A program reviews the property’s rent and coverage, not the employment total.
Is small multifamily realistic here?
Availability is the constraint. Duplexes and small buildings are 8.72% of housing, so inventory is limited. The upside is that a scarce product with two rent streams can carry debt better than a single-family house at a similar price.
For current guidelines and terms, see Lendmire’s DSCR loan programs page.
About Lendmire
Lendmire, NMLS# 2371349, is a mortgage brokerage focused on investor financing, arranging DSCR loans in 40 states plus Washington, D.C. — 41 markets total. Qualification is based on the property’s income rather than personal income documentation, subject to lender guidelines, making it a fit for LLC-held rentals and scaling portfolios. The firm is recognized as a 2026 Scotsman Guide Top Workplace and a top-ranked workplace in 2025.
Get Started
Ready to find the right loan for you?
In about 30 seconds you can review financing options available for your investment property. No commitment required.
Informational only. Not a Loan Estimate, approval, or commitment to lend. Program availability and eligibility are subject to lender guidelines, credit approval, property review, and underwriting.
References
2. Redfin, Jeffersontown Housing Market
3. NeighborhoodScout, Jeffersontown Real Estate
4. City of Jeffersontown, Business Advantages
5. Homes.com
6. Movoto
7. The Lane Report, Jeffersontown
9. One Louisville, Jeffersontown
11. Apartments.com — Jeffersontown KY
12. Apartments.com — Jeffersontown KY Recent Build
13. a 2026 Scotsman Guide Top Workplace
14. Scotsman Guide — Top Workplaces 2025
This article is part of Lendmire’s investment property cash-out refinance program — full qualification details, guidelines, and scenarios live on the program page.
Related reading: DSCR Cash Out Refinance Jeffersontown Kentucky · Cash Out Refinance on Investment Property in Hopkinsville KY · DSCR Cash Out Refinance for Henderson, KY Investors
Guides: Investment Property Cash-Out Refinance in Kentucky
Brandon Miller
Founder & CEO, Mortgage Loan Originator, Lendmire LLC
- Mortgage Loan Originator · NMLS# 1129696 · Verify on NMLS Consumer Access
- North Carolina Real Estate Broker · License# 343312 · Verify on NCREC
- North Carolina Insurance Producer · License# 19053198 · Property, Casualty, Life, Health · Verify on NAIC SBS
- Lendmire LLC · Firm NMLS# 2371349 · Verify firm licensure
Important disclosures. Lendmire (NMLS# 2371349) is a licensed mortgage brokerage. Lendmire is not a direct lender, depository institution, or financial advisor. All loan inquiries are subject to lender underwriting; this article does not constitute a commitment to lend. Rates, terms, and program guidelines are subject to change without notice and vary by borrower profile, property type, and state. Information in this article is general in nature and is not financial, legal, or tax advice. Equal Housing Opportunity. NMLS Consumer Access: nmlsconsumeraccess.org.