
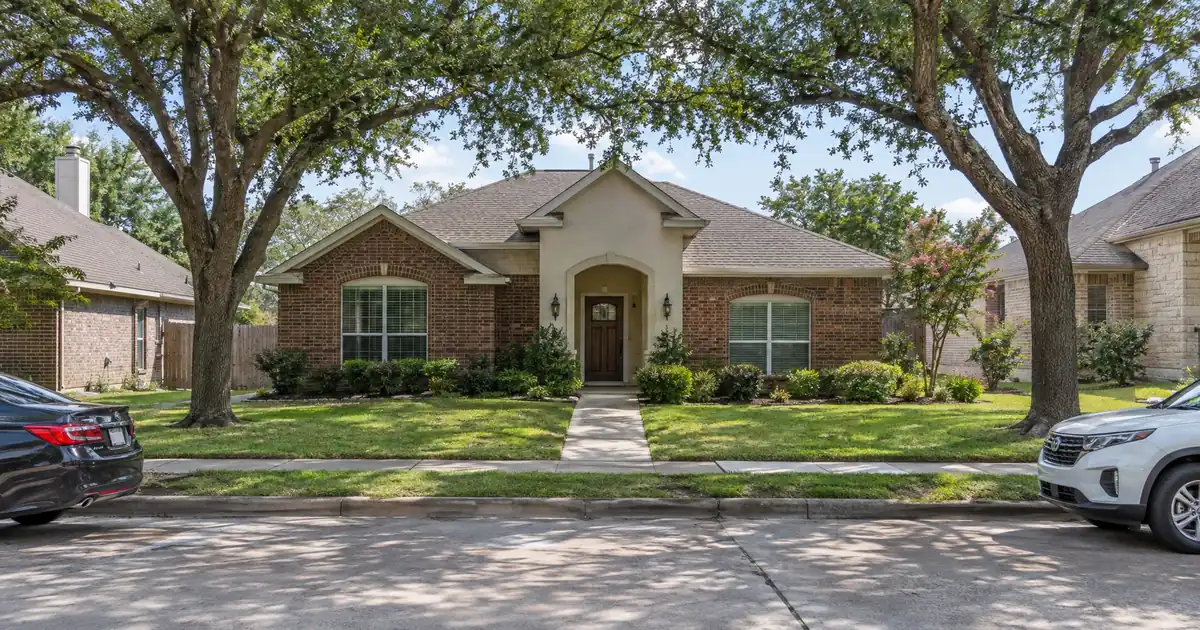
A Garland cash-out refinance starts with one hard constraint: the loan can’t exceed 75 percent of an appraised value that has been drifting down, not up. Redfin puts the median sale price near $287K, down 4.3 percent year over year. Equity here comes from what you paid, what you fixed, and how much principal you’ve retired. Market lift is not a reliable source.
At a Glance: A DSCR cash-out refinance in Garland, Texas is underwritten primarily on the property’s rental income measured against its full monthly obligation, then sized to the lower of the coverage test and the 75 percent loan-to-value ceiling on the appraisal.
DSCR Cash-Out Calculator
Run the cash-out numbers in Garland, TX
Rate source: Freddie Mac 30-yr average via FRED® — Federal Reserve Bank of St. Louis · effective Sep 24, 2026
Prefilled with starting assumptions — enter your property’s value, balance, taxes, and insurance for a more accurate picture.
Program parameters update from Lendmire’s centralized guideline source. Taxes and insurance are editable estimates.
As of Sep 24, 2026 · General Freddie Mac market benchmark, not a Lendmire loan offer. Property value, balance, taxes, and insurance are editable estimates. Maximum loan-to-value varies by lender, program, property type, and seasoning. Not a Loan Estimate, approval, or commitment to lend. Program availability and eligibility are subject to lender guidelines, credit approval, property review, and underwriting.
- Median sale price sits near $287K, down 4.3 percent year over year per Redfin.
- South Garland shows the best rent-to-price ratio, roughly 0.53 percent monthly (directional).
- North Garland prices run highest, with the thinnest rent-to-price ratio, roughly 0.44 percent.
- Seasoning is about six months from title recording, and the LTV cap for cash-out is 75 percent.
- Only six multifamily listings turned up citywide, so single-family is the base case.
Lendmire works with Garland, Texas investors to place DSCR financing through wholesale lenders reaching 41 markets — 40 states plus Washington, D.C. Lendmire (NMLS# 2371349) is a DSCR-focused mortgage broker. It arranges these loans, and the lenders in its network review eligibility and approve. The rest of this piece covers the extraction side only: what Garland appraisals can support, where the coverage ratio holds, and how proceeds get redeployed.
Garland Market Snapshot
A quick read on the Garland investor landscape — figures come from the cited sources below. Confirm current property-level numbers before underwriting.
| Metric | Detail |
|---|---|
| Population | 250,000+ residents (Garland Economic Development) |
| Employment | 124K jobs (Data USA) |
The Appraisal Is the Constraint
The binding number in Garland is appraised value, not the borrower’s rent roll. Prices have softened across several sources, so the 75 percent ceiling is applied to a moving target. Pull the equity from a rental you bought at a discount or improved, not from one you’re counting on the market to lift.
The citywide median depends on who you ask. Redfin’s figure, $287K, is the one used throughout this piece. A local broker’s market update reports a higher year-end median of $305,000, down 4.6 percent, and Zillow shows values down 1.4 percent over the trailing year. The methodologies differ, but the direction agrees. A vendor blog claiming Garland is the fastest-appreciating city in the metro conflicts with every primary aggregator, and it shouldn’t anchor a refinance thesis.
The mechanics are simple. Eligibility generally requires about six months of ownership measured from title recording. The cash-out LTV ceiling is 75 percent. Reserves typically run about six months of full monthly obligation, and the credit floor is 620, with better tiers at 660, 680, and 700. Loan amounts on standard programs run up to $3,000,000, which Garland’s price points never approach. All of it is subject to lender guidelines, and equity available is not a guaranteed cash figure. It depends on the appraisal, rent used for lender review, and reserves.
Consider a scenario where an investor bought a Garland three-bedroom eight months ago at a meaningful discount to comparable sales and completed a punch list. The appraisal, not the purchase price, sets the ceiling. If it lands near the purchase price, the seasoning clock cleared but the equity didn’t. That’s the gap DSCR cash-outs in flat markets live or die on.
How the Coverage Math Actually Runs
Coverage is monthly rent divided by full monthly obligation: principal, interest, taxes, insurance, and any HOA dues. In Garland at full leverage, that ratio lands right at 1.00 in the best case and below it in most. The 1.00 baseline is common because rent covers the payment at that level. Some lenders will look at lower ratios with compensating factors such as lower leverage, different pricing, or more reserves.
Here is a worked example, using modeled assumptions rather than cited market facts. Take a three-bedroom appraising at $300,000 with $2,150 in monthly rent. That rent tracks the RentHop three-bedroom listing median, which includes houses. The coverage figure below is calculated on full obligation including taxes and insurance, and rounded down.
| Scenario | Modeled value | Modeled rent | Coverage |
|---|---|---|---|
| Full 75 percent LTV | $300,000 | $2,150 | about 1.00 |
| Reduced to 65 percent LTV | $300,000 | $2,150 | low-1.1 range |
| Full 75 percent LTV, south ZIP | $347,000 | $1,835 | high-0.7s |
| Reduced to 65 percent LTV, south ZIP | $347,000 | $1,835 | mid-0.8s |
Two things stand out. First, the borrower who wants every available dollar of proceeds is often the borrower whose ratio is thinnest. Pulling back to 65 percent LTV can lift coverage across the 1.00 line at the cost of proceeds. Second, the south ZIP row shows why rent-to-price ratios matter more than absolute rent.
Where a file lands below 1.00, the options are structural. A lender may review a sub-1.00 program, lower leverage, or an interest-only structure to improve the ratio. Those are paths to discuss, and none is a promise that a given property qualifies.
DSCR files in markets like this one typically look like flat-to-soft appraisals, rents that pencil near the coverage line rather than well above it, and a file where the leverage choice matters more than the property. The cleanest file from a documentation standpoint has complete leases, entity docs, title, and property details ready for lender review. Rent is underwritten on the lease or the appraiser’s market rent schedule, whichever the lender’s program calls for. That means a lease signed above market doesn’t buy extra proceeds. For the mechanics behind the ratio, see the DSCR qualification mechanics.
South and Southwest Garland: Where the Ratio Holds
South and southwest Garland (ZIPs 75041 and 75042) offer the best rent-to-price ratio in the city, which makes them the most DSCR-achievable ground even at lower absolute rents. Listing medians run $346,860 in 75041 and $333,675 in 75042, per HAR.com. These are listing prices, not sale prices.
Against Redfin’s South Garland neighborhood median rent of $1,835 (a table that mixes property types), 75041 works out to roughly 0.53 percent of price per month. That ratio is derived from two different sources and should be read as directional. It’s still the strongest in the city.
The strength is relative, though. The modeled table above shows this stock at full leverage sitting well under 1.00 on a mid-$300s appraisal with a median rent. The workable version is a lower-basis property or a bigger floor plan that rents toward the three-bedroom listing median. The other route is lower leverage on the refinance. An investor who bought a south Garland house below the ZIP median and has rent-ready condition has the best chance of getting a proceeds figure worth the closing cost.
The tenant story is workforce rental demand tied to the city’s manufacturing base, covered below. Older stock also means capex risk, which comes up again near the end.
East and North Garland: Skip the Premium Unless the Rent Follows
East and north Garland carry the highest prices with proportionally less rent, so coverage thins as price rises. Median listing prices run $403,433 in 75043 (the Lake Ray Hunt side) and $450,647 in 75044 (the Firewheel area). The Redfin neighborhood rents of $1,950 for East Garland and $2,000 for North Garland imply roughly 0.48 and 0.44 percent monthly against those prices. Both are derived and directional.
Every extra $100,000 of price adds a much larger increment to the obligation than to the rent. A north Garland rental appraising in the mid-$400s would likely need a materially reduced LTV to clear 1.00. That makes it a poor fit for a max-proceeds strategy, though it can suit a long-hold investor prioritizing stability.
It’s a toss-up for some borrowers. The north’s rent per unit is the highest in the city, which is good for cash flow in absolute terms, and the buyer pool is deepest. But the coverage ratio favors the south, and a cash-out is a coverage-constrained product. East Garland also has the largest listing pool, which means plenty of comparable sales for appraisers to work from. That helps valuation support even where the ratio is average.
Downtown, Forest/Jupiter, and the Rail Corridor
Downtown Garland (75040) offers lower entry pricing and rail access, which helps tenant retention more than it helps proceeds. The 75040 median listing price is $349,039 at $184 per square foot. Apartments.com lists Downtown Garland and Castle Point among the most affordable neighborhoods for renters.
The two DART Blue Line stations, Downtown and Forest/Jupiter, are each cited by a local broker’s market page as serving more than 3,000 weekday riders. Treat that as moderately reliable. The Dallas College Garland Center sits nearby as a workforce-training campus. It’s not a large four-year school, so student-rental demand isn’t a driver here. Transit access and proximity to an employment center support long-term tenancy, which is the profile lenders like to see.
Rent.com reports one-bedroom rents ranging from $875 in Park Groves to $1,605 in Northeast Garland, with Walnut at $1,180 and Forest Ridge at $1,095. That’s apartment data, and it says little about single-family coverage. It does show the city’s rent ladder runs steeply from the southeast to the northeast.
What Keeps Tenants in Garland
Garland’s tenant base rests on manufacturing and distribution jobs, a commuter workforce, and a large stock of older houses. Garland Economic Development says the city hosts more than 300 manufacturers and names Garland ISD, the City of Garland, Kraft Heinz, Sherwin-Williams, and Epiroc among top employers. I found no current headcounts for individual employers, so none are given.
Resident-worker data from Data USA shows construction (15,848), retail trade (14,294), and manufacturing (12,785) as the largest industries by resident workers, within an economy employing about 124K. City-Data reports a daytime population change of minus 37,079 from commuting, so Garland is a bedroom community feeding jobs elsewhere in the metro. Housing follows employment across a wider area than the city limits.
Population is roughly 250,571 per Census Bureau QuickFacts. RentCafe reports about 38 percent of households rent, which leaves a deep enough renter pool to support single-family leasing at scale. Point2Homes shows two-bedroom units as the largest share of rentals at 36 percent, and roughly 27 percent of rental units date to the 1970s, with another 19 percent from the 1980s. That points to a long-tenured tenant base in aging stock, which supports steady occupancy but demands a capex plan.
One local distinction worth knowing: Garland Power & Light, the municipal utility, serves about 85 percent of residents per the City of Garland. Most Texas tenants pick a retail electric provider, so this changes move-in utility setup. There’s no evidence it changes DSCR underwriting, and none should be assumed.
Duplexes and Fourplexes: A Thin Pool
Small multifamily can stack rent onto a single mortgage, but Garland’s supply is too thin to build a strategy on. Pricing and available terms vary by lender, borrower profile, property type, and full underwriting review.
The income-stacking case is real where it exists. One Garland two-home listing previously leased its main house at $1,950 and its back house at $1,180, utilities included, roughly $3,130 a month from one parcel. Set that against the Apartments.com average two-bedroom rent of $1,543. It’s a single listing, so treat it as an illustration and not a market average. Two units on one lot can lift the ratio above what a lone house at a similar price produces, but only if each unit’s rent is documented with actual leases or an appraiser’s schedule.
The shallow pool has a cash-out consequence. Appraisers with few nearby multifamily comps pull from a wider radius, which can cap value and proceeds. Keep single-family as the base case and treat duplexes as opportunistic.
DSCR vs. conventional financing
Two common ways to finance an investment property in Garland, TX. They qualify you differently — here’s how investors weigh them.
Why investors choose it
- Qualifies on the property’s rental income — no personal tax returns, W-2s, or pay stubs needed to document income.
- No personal debt-to-income ceiling to clear, so existing mortgages and obligations don’t cap your borrowing the same way.
- Can be closed in an LLC, keeping the property inside a business entity.
- Built for scaling — not held to the limit on number of financed properties that conventional financing applies.
- Underwriting centers on the deal: generally qualifies when the rent covers the payment, a 1.00x coverage ratio being a common baseline (confirmed in underwriting).
- Designed specifically for investment property, including long-term and, where the program allows, short-term rentals.
Where it’s strong
- Often the lowest ongoing financing cost for a buyer who fully qualifies on personal income — a fit for a first property or a cost-first purchase.
Trade-offs for investors
- Requires full personal income documentation and must fit within a debt-to-income limit — salary, existing debts, and other mortgages all count.
- Typically held in your personal name rather than a business entity.
- Caps how many financed properties you can carry, which can become a ceiling as a portfolio grows.
- Evaluates you as a borrower as much as the property, which usually means more paperwork.
How investors usually choose: a first or single property often optimizes for the lowest financing cost; portfolio builders often optimize for leverage, vesting in an LLC, and scaling past conventional caps. The right answer depends on your goals, the property, and current guidelines — both paths run through select lenders in Lendmire’s wholesale network, with eligibility and terms confirmed in underwriting.
Rent Softness: Underwrite What’s in Place
Garland rents are flat to slightly down, so underwrite in-place rent and assume no escalation. Apartment List reports a median of $1,292, down 2.5 percent year over year. RentCafe puts the average apartment at $1,423, essentially flat, with two-bedrooms at $1,545 and three-bedrooms at $1,900. Sources differ because they measure different property mixes. Apartment-heavy indexes read lower, and listing-based ones that include houses read higher.
The Dallas Fed attributes lower Texas apartment vacancy to more concessions and pricing, and projects a gradual return of rent growth ahead. That’s a regional read, and I found no Garland submarket absorption data. The practical takeaway: concessions from newer apartment competitors can cap growth on lower-end units, so a coverage number built on asking rent overstates what a lender will use.
Where Most Garland Cash-Outs Go Wrong
A common mistake is sizing proceeds to a hoped-for value and then discovering the appraisal came in lower. The second is ignoring deferred maintenance on 1970s and 1980s stock before the appraiser walks it. Budget the roof, HVAC, and foundation-adjacent items first, because condition drives the value opinion. Before pursuing any refinance, verify current local rental rules, property taxes, and insurance with qualified local professionals.
Proceeds should have a defined next use before the file is submitted. The typical play is a down payment on the next rental, and LLC-titled vesting may be available subject to lender program eligibility. Seasoning applies to the property being pulled from, so the clock on the next purchase starts fresh. For a broader look at the equity side, see the refinance options in the guide “The Refi Options”. Investors working across the state can also review Lendmire’s Texas DSCR investor loans page.
Frequently Asked Questions
How do you qualify for a DSCR cash-out refinance in Garland?
Qualification centers on the property’s rent used for lender review measured against full monthly obligation, with a common 1.00 baseline, about six months of seasoning, and a 620 credit floor. Reserves typically run about six months. On Garland’s flat-to-soft appraisals, the LTV ceiling of 75 percent often matters as much as the coverage test. Terms are subject to lender guidelines and property review.
What are the requirements for an investment property loan in Garland, Texas?
Expect a signed lease or rent schedule, entity documents if the property is LLC-titled, title, insurance, and an appraisal. Credit tiers run 620, 660, 680, and 700, and better tiers improve pricing and leverage options. Loan sizes reach $3,000,000 on standard programs, though Garland balances are far below that. Manufactured homes, log homes, and barndominiums fall outside these programs.
Which Garland ZIP codes pencil best for cash-out coverage?
South and southwest Garland (75041 and 75042) show the best directional rent-to-price ratio, near 0.53 percent monthly, against 0.44 percent in the north. That doesn’t mean coverage clears 1.00 at full leverage. It means the south needs less rent per dollar of price to get there. North Garland’s higher prices usually require reduced leverage.
Can a duplex help a Garland cash-out clear 1.00?
It can, because two rents sit against one obligation, but the pool is very thin. Only six multifamily listings surfaced citywide, and many were larger properties. Comps are shallow, so appraisers may pull from a wide radius. Documented leases for both units are essential.
Can Lendmire help arrange DSCR financing for an investment property in Garland?
Yes. Lendmire arranges DSCR investor loans, and DSCR loans are generally reviewed around the property’s rental income rather than personal income documents. Cash-out refinances are available up to a 75 percent LTV ceiling, subject to lender guidelines. Call 828-256-2183 to discuss a scenario.
The Broker’s Read
A local appraiser would tell you Garland’s south and southwest neighborhoods still trade on older three-bedroom houses, and that condition moves the number more than the zip code does. The houses that pull the most equity are the ones bought under market and cleaned up before the appraiser arrives. Every other Garland cash-out is a bet that the city’s softening prices stop softening.
About Lendmire
As a non-QM mortgage broker (NMLS# 2371349), Lendmire facilitates DSCR investor loans across 41 markets, including Washington, D.C. DSCR eligibility is generally reviewed around property-level rental income instead of personal income documentation, subject to lender guidelines. That serves LLC-structured portfolios and self-employed borrowers who don’t fit conventional boxes. Lendmire was recognized by Scotsman Guide as a 2026 Top Workplace and recognized by Scotsman Guide in 2025, making it a two-time Top Mortgage Workplace.
Get Started
Ready to find the right loan for you?
In about 30 seconds you can review financing options available for your investment property. No commitment required.
Informational only. Not a Loan Estimate, approval, or commitment to lend. Program availability and eligibility are subject to lender guidelines, credit approval, property review, and underwriting.
References
1. Redfin, Garland housing market
2. Garland Economic Development
4. Zillow
5. RentHop
6. HAR.com
7. Dallas College Garland Center
8. Garland Economic Development, Key Industries
10. City of Garland, New Resident Info
11. Apartments.com
12. Apartment List
13. Dallas Fed, Texas multifamily research
14. recognized by Scotsman Guide as a 2026 Top Workplace
15. recognized by Scotsman Guide in 2025
This article is part of Lendmire’s investment property cash-out refinance program — full qualification details, guidelines, and scenarios live on the program page.
Related reading: Cash Out Refinance Investment Property Garland Texas · Investment Property Loans in Dallas, TX: Will the Rent Cover the Note Here? · DSCR Cash Out Refinance Grand Prairie Texas
Guides: Investment Property Cash-Out Refinance in Garland, TX · Investment Property Cash-Out Refinance in Texas
Brandon Miller
Founder & CEO, Mortgage Loan Originator, Lendmire LLC
- Mortgage Loan Originator · NMLS# 1129696 · Verify on NMLS Consumer Access
- North Carolina Real Estate Broker · License# 343312 · Verify on NCREC
- North Carolina Insurance Producer · License# 19053198 · Property, Casualty, Life, Health · Verify on NAIC SBS
- Lendmire LLC · Firm NMLS# 2371349 · Verify firm licensure
Legal disclosures. Lendmire (NMLS# 2371349) is a state-licensed mortgage brokerage that arranges financing through wholesale lender relationships. Lendmire is not a direct lender, depository institution, or registered financial advisor. The discussion above is general informational content about real estate financing — it is not financial, legal, or tax advice, and readers should consult licensed professionals for guidance on their individual circumstances. Loan inquiries are subject to lender underwriting; this article does not represent a commitment to lend. Loan terms, rates, and qualification standards vary by borrower, property, and state, and are subject to change at any time. Equal Housing Opportunity. NMLS Consumer Access: nmlsconsumeraccess.org.