
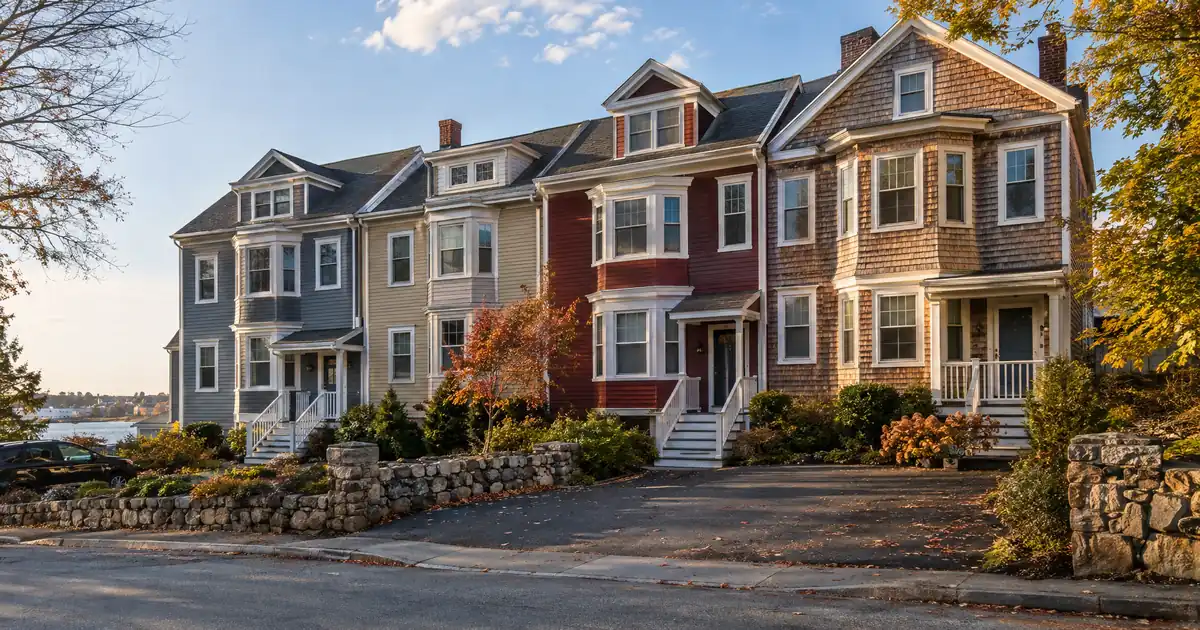
Picture an investor holding a South End three-family bought at $475,000 a while back. The units are occupied, the tenants have stayed put, and the rents haven’t moved much since the day of purchase. The building is worth more than the basis, but the equity is locked inside it. Getting it out without selling is a documentation problem before it’s a pricing problem, and that’s what this piece walks through.
At a Glance: A DSCR cash-out refinance in New Bedford, Massachusetts is underwritten primarily on the property’s rental income measured against its full monthly obligation, so the file turns on documented rents, appraised value, and ownership seasoning rather than the borrower’s traditional personal-income documentation. Exact structure stays subject to lender guidelines, credit review, and property inspection.
DSCR Cash-Out Calculator
Run the cash-out numbers in New Bedford, MA
Rate source: Freddie Mac 30-yr average via FRED® — Federal Reserve Bank of St. Louis · effective Sep 24, 2026
Prefilled with starting assumptions — enter your property’s value, balance, taxes, and insurance for a more accurate picture.
Program parameters update from Lendmire’s centralized guideline source. Taxes and insurance are editable estimates.
As of Sep 24, 2026 · General Freddie Mac market benchmark, not a Lendmire loan offer. Property value, balance, taxes, and insurance are editable estimates. Maximum loan-to-value varies by lender, program, property type, and seasoning. Not a Loan Estimate, approval, or commitment to lend. Program availability and eligibility are subject to lender guidelines, credit approval, property review, and underwriting.
- Multi-unit stacking, not single-family, is the realistic route to coverage at local prices.
- Average home value is $444,977, up 3.0 percent, per Zillow.
- Two-bedroom rents run $1,650 to $2,165 depending on source (RentHop, RentCafe).
- Cash-out typically tops out at 75 percent LTV after about six months of seasoning.
- South End and North End hold the deepest supply of two-to-four-unit stock.
Lendmire, a DSCR-focused mortgage broker, arranges these files through wholesale lending channels. Lendmire’s DSCR program footprint covers New Bedford, Massachusetts as part of a 41-market reach that includes Washington, D.C. The state-level overview lives on the page for DSCR loan options for Massachusetts investors, and the guide “What Is a DSCR Loan” covers how the ratio itself works. This article stays on the exit side: what the building has to show before equity comes out.
New Bedford Market Snapshot
A quick read on the New Bedford investor landscape — figures come from the cited sources below. Confirm current property-level numbers before underwriting.
| Metric | Detail |
|---|---|
| Home prices | 117 sales (Redfin Housing Market) |
| Employment | 6,800 direct jobs (Port of New Bedford) |
The Triple-Decker Carries the Coverage Math
Multi-unit is the path. At citywide average rents of roughly $1,550 per Zumper and $1,650 per Zillow Rental Manager, a single rent check rarely covers a mortgage sized to a $412,000-plus building. A two-to-three-family collects several checks against one value.
Run the numbers on a modeled three-family. Assume a $550,000 appraised value, a 75 percent LTV cash-out, and $4,700 in monthly rent. That rent figure is the annualized $56,400 from a Homes.com three-family listing, and it’s an assumption here, not an underwriting number. Rent over full PITIA, meaning principal, interest, taxes, and insurance, lands around 1.3x. Haircut that rent by 15 percent, the way a conservative appraiser’s schedule might, and coverage falls to roughly 1.15x including taxes and insurance. Still above the 1.00 baseline.
Now the single-family comparison. Model a $450,000 house at the same 75 percent LTV renting at $2,700, which is Zumper’s average for a house. Coverage comes in just under 1.00x including taxes and insurance. Drop to an apartment-level rent near $1,650 and it isn’t close. Single-family at these prices is a hold, not a cash-out candidate.
Homes.com puts multi-family listings from $380,000 to $1.6 million, so the price band is wide. Coverage depends on which end of it the building sits.
A note on how DSCR files in markets like this one typically look. Older two-to-four-unit stock with modest in-place rents tends to show decent coverage on paper, then gets tested on the rent schedule, the payoff mechanics, and how much the appraiser trusts the comps. Files with clean lease documentation and rents near the appraiser’s market figure move through review with far fewer questions than files where the rents are informal.
South End, North End, and Everywhere Else
The South End is the strongest cash-out submarket in the city, and the North End is a close second. Both have dense two-to-five-unit inventory, and both show the rent-stacking pattern that makes coverage work at 75 percent LTV.
South End. Homes.com’s South End multi-family page shows listings from $475,000 to $1.15 million and a neighborhood median of $419,900. Treat those as directional, because portals compute medians differently. The housing stock is converted Colonials, Foursquares, and cottages, and renters include artists and young professionals drawn to the water. One listed three-unit near the Cove has two-bedroom units on separate gas and electric meters, with long-term tenants-at-will at undermarket rents. That’s the classic value-add setup, and it’s also the one lenders scrutinize hardest. Undermarket rents mean the lender weighs in-place leases against the appraiser’s schedule, and tenants-at-will mean the lease documentation is thinner. Rent.com puts the South End one-bedroom average at $1,400, which is the low end of the city.
North End. A three-unit listing on Homes.com shows rents of $1,800, $1,800, and $1,400, or $5,000 a month. That’s one listing, not a market average. The neighborhood also has the commuter rail station at Church Street and a large five-unit listed near it. Five units is a program question, since most DSCR programs stay with four units on residential-style terms. Check the specific program before counting on a five-unit refinance.
Buttonwood Park and Westview Park. Single-family medians here run about $483,000 in the listing data. Big Victorian and Colonial rental homes suit workforce single-family or premium duplexes. For cash-out, it’s the tight end of the math: high value, one rent check. Skip it unless the property is a legal duplex.
Downtown. The historic waterfront has restaurants, galleries, and the whaling museum, and a one-bedroom averages $1,637. Condos are cheap on paper, but that’s exactly why a cash-out here yields little equity. Skip it for this strategy.
West End. Small historic multis with character, such as a whaling-era four-family listed on the West Side. I found no reliable West End rent or price source, so the numbers have to come from the appraisal, not from a neighborhood guess.
What Does the Appraiser Actually See?
The appraiser sees comps, not the Zillow index. New Bedford’s headline value numbers point in different directions: Zillow’s index is up 3.0 percent, while Redfin shows a median sale price of $472,000, down 2.7 percent, with sales dropping to 117 in the latest month from 137. Those measure different things, one an automated value index and the other closed sales. The honest read is a market that’s roughly flat to modestly up.
Rents are flat too. Zillow shows rent down $150 year over year, and the aggregators split sharply. RentCafe’s $2,051 average reflects larger professionally managed buildings, while the small-landlord sources cluster lower: Rentometer shows a three-bedroom at $2,057, and RentHop shows $1,913. Small two-to-four-unit owners should underwrite to the lower listing-based figures. The lender’s rent schedule will probably land there, not at the RentCafe average.
So where does the proceeds check come from? Not market drift. With values up in low single digits and rents flat, cash-out proceeds come mostly from a lower-basis purchase or from renovation-driven value gains. That’s the reader in the opening scenario: a building bought below where comparable stock trades, or one that’s been rehabbed since purchase. Never treat a citywide median as the refinance value. Comps get pulled at the neighborhood and building-type level, and a South End three-family gets compared to South End three-families.
The paper trail for a multi-unit file usually includes:
- Signed leases for every unit, or a clear explanation where tenants are month to month.
- A rent schedule from the appraisal, compared against in-place rents.
- Proof of hazard coverage on the full building.
- A payoff statement for the existing mortgage.
- Title records showing the recording date, since seasoning runs from there.
Missing or informal leases are the most common friction point in older triple-decker files. If a lender asks for an explanation, that usually adds review time rather than ending the file.
Seasoning, LTV, and the Paper Trail
Seasoning runs about six months of ownership, measured from title recording, and the ceiling is 75 percent LTV on a cash-out. Those are typical program figures, so confirm them against the specific lender’s guidelines. An investor who bought and recorded the deed recently will hit the seasoning check before hitting a value problem.
The other typical parameters:
- Coverage: 1.00 is the common baseline, meaning rent used for lender review equals PITIA. Some lenders review lower ratios with stronger compensating factors.
- Credit: the floor is 620, with tiers at 660, 680, and 700 that generally improve leverage and pricing options.
- Reserves: about six months of PITIA, held after the refinance.
- Loan size: up to $3,000,000 on standard programs. New Bedford multi-family files sit far inside that. Smaller balances route through select lenders in the network.
Equity available is not a guaranteed cash figure. It’s the lesser of what the 75 percent ceiling allows and what the coverage math supports, minus the payoff and reserves. On a triple-decker with weak in-place rents, coverage becomes the binding constraint before LTV does. For the mechanics, see DSCR cash-out refi mechanics and the refinance pathway for investor properties. Titling in an LLC is generally workable, subject to lender program eligibility.
One more tension worth naming. Investors who want the cash for a second building should check that proceeds plus reserves actually clear the next deal’s down payment. A cash-out that leaves the first property at thin coverage and the second one underfunded isn’t a win.
Demand Anchors (and One That Isn’t)
New Bedford’s rental demand is steady rather than explosive, and that fits a cash-out thesis. The Census Bureau puts the population at 101,318, barely above the 101,079 counted in 2020. About 60 percent of households rent, per RentCafe. A rent-heavy, flat-population city doesn’t produce appreciation spikes, but it does produce consistent tenant pools.
The employment anchors are concrete:
- Health care. Southcoast Health has more than 8,500 employees and is the largest employer in southeastern Massachusetts, per the New Bedford Guide. St. Luke’s, a Level II Trauma Center, is the in-city hospital.
- The port. The Port of New Bedford reports more than 6,800 people directly employed. That figure is older data, so treat it as directional. New Bedford is the number-one value fishing port in the nation.
- Education. UMass Dartmouth sits in the adjacent town of Dartmouth, with 5,986 undergraduates.
Hospital and university staff are steady renters for workforce two-to-three-family units.
Rail helps at the margin. WBUR reports that passenger service to South Station returned after more than 65 years, on a trip of just over 90 minutes. The city has set up transit-oriented development districts within a half-mile of each station. Underwrite rail as a modest tailwind, not a rent-growth catalyst. Neither station sits where a housing boom is likely to start.
The offshore wind terminal is the one that isn’t an anchor. WSHU reports that SouthCoast Wind has been delayed indefinitely and the terminal is now seeking new uses. Don’t underwrite a wind-driven job wave. The honest picture is a port diversifying beyond fishing.
Where Sub-1.00 Leaves You
A file that comes in under 1.00 on in-place rent isn’t automatically dead, but it gets harder. The paths a lender may review include a sub-1.00 program, an interest-only structure, or lower leverage than the 75 percent ceiling. Each usually comes with compensating factors such as stronger credit, deeper reserves, or more cash left in the deal. Qualification stays subject to lender guidelines, credit approval, and property review.
This is the single-family scenario from earlier. A $450,000 house renting at $2,700 sits just under the baseline, so a lower LTV can bring it back near 1.00x. Whether that leaves enough proceeds to justify the refinance is a different question. For a rental that cash-flows thinly, holding may beat extracting.
DSCR vs. conventional financing
Two common ways to finance an investment property in New Bedford, MA. They qualify you differently — here’s how investors weigh them.
Why investors choose it
- Qualifies on the property’s rental income — no personal tax returns, W-2s, or pay stubs needed to document income.
- No personal debt-to-income ceiling to clear, so existing mortgages and obligations don’t cap your borrowing the same way.
- Can be closed in an LLC, keeping the property inside a business entity.
- Built for scaling — not held to the limit on number of financed properties that conventional financing applies.
- Underwriting centers on the deal: generally qualifies when the rent covers the payment, a 1.00x coverage ratio being a common baseline (confirmed in underwriting).
- Designed specifically for investment property, including long-term and, where the program allows, short-term rentals.
Where it’s strong
- Often the lowest ongoing financing cost for a buyer who fully qualifies on personal income — a fit for a first property or a cost-first purchase.
Trade-offs for investors
- Requires full personal income documentation and must fit within a debt-to-income limit — salary, existing debts, and other mortgages all count.
- Typically held in your personal name rather than a business entity.
- Caps how many financed properties you can carry, which can become a ceiling as a portfolio grows.
- Evaluates you as a borrower as much as the property, which usually means more paperwork.
How investors usually choose: a first or single property often optimizes for the lowest financing cost; portfolio builders often optimize for leverage, vesting in an LLC, and scaling past conventional caps. The right answer depends on your goals, the property, and current guidelines — both paths run through select lenders in Lendmire’s wholesale network, with eligibility and terms confirmed in underwriting.
Frequently Asked Questions
How do you qualify for a DSCR cash-out refinance in New Bedford, Massachusetts?
The property has to show enough rent used for lender review against its full PITIA, typically at or above 1.00x, with about six months of ownership seasoning and a credit score at or above the 620 floor. The lender reviews the appraisal’s rent schedule, in-place leases, and reserves. For a New Bedford three-family, the appraisal’s rent figure often decides the file more than the tenants’ actual payments do.
What are the requirements for an investment property cash-out refinance in New Bedford, Massachusetts?
Typical guidelines cap cash-out at 75 percent LTV, require about six months of PITIA in reserves, and offer credit tiers at 620, 660, 680, and 700. Loan sizes run up to $3,000,000 on standard programs. Verify current local rental rules, taxes, and insurance with qualified local professionals, and confirm specifics with the lender.
Will a New Bedford single-family rental clear the coverage test on a cash-out?
Usually not comfortably. At local prices, a house needs rent near Zumper’s $2,700 house average just to approach 1.00x including taxes and insurance, and apartment-level rents fall well short. Multi-unit properties are the more realistic path. Some single-family files still work with lower leverage or a sub-1.00 program.
Does South Coast Rail raise the appraised value of a New Bedford multi-family?
Not enough to build a refinance around. Rail adds commuter demand and some new supply near the stations, but rents are broadly flat and values are moving in low single digits. Appraisers still value the building off local comps.
Can Lendmire help investors explore DSCR financing for properties outside Massachusetts?
Yes. A core feature is that qualification centers on the property’s rental income rather than the borrower’s traditional personal-income documentation, subject to program guidelines.
The Next Step
Before requesting any quote, pull twelve months of actual rent collections for the building and get an independent market-rent opinion from a local property manager who works the South End or North End. In a city where five rent aggregators can’t agree on the average two-bedroom, the only number that matters is the one a signed lease and an appraiser’s rent schedule can both defend. If they agree, the cash-out math is real. If they don’t, fix the leases first.
Investors ready to structure a file can call 828-256-2183.
For current guidelines and terms, see Lendmire’s DSCR loan programs page.
About Lendmire
As a DSCR and non-QM mortgage broker, Lendmire (NMLS# 2371349) connects investors with wholesale lending channels across 41 markets, including Washington, D.C. Program review centers on the property’s rental income rather than the borrower’s traditional personal-income documentation, which works for self-employed operators and portfolios beyond four financed properties. Lendmire was named a 2025 Scotsman Guide Top Mortgage Workplace and a top-ranked workplace in 2026; see the 2026 Top Workplace recognition announcement for details. A side-by-side comparison of the different program types is also available.
Get Started
Ready to find the right loan for you?
In about 30 seconds you can review financing options available for your investment property. No commitment required.
Informational only. Not a Loan Estimate, approval, or commitment to lend. Program availability and eligibility are subject to lender guidelines, credit approval, property review, and underwriting.
References
1. Zillow Home Values, New Bedford
2. RentHop
3. RentCafe
4. Redfin Housing Market, New Bedford
5. Port of New Bedford, Economic Impact
6. Zumper
8. Homes.com
9. South End multi-family page
10. Rentometer
11. U.S. Census Bureau QuickFacts, New Bedford
13. New Bedford Guide, Southcoast Health
14. UMass Dartmouth
16. WSHU, New Bedford Harbor Terminal
17. a 2025 Scotsman Guide Top Mortgage Workplace
18. Scotsman Guide — Top Workplaces 2026
19. the 2026 Top Workplace recognition announcement
This article is part of Lendmire’s investment property cash-out refinance program — full qualification details, guidelines, and scenarios live on the program page.
Related reading: Luxury Rental DSCR Loans In New Jersey · Jersey Shore Vacation Rental Loans: DSCR Financing In Ocean City, Cape May And Long Beach Island · DSCR Cash-out Refinance In New Jersey: Pulling Equity From A Rental
Guides: Investment Property Cash-Out Refinance in New Bedford, MA · Investment Property Cash-Out Refinance in Massachusetts
Brandon Miller
Founder & CEO, Mortgage Loan Originator, Lendmire LLC
- Mortgage Loan Originator · NMLS# 1129696 · Verify on NMLS Consumer Access
- North Carolina Real Estate Broker · License# 343312 · Verify on NCREC
- North Carolina Insurance Producer · License# 19053198 · Property, Casualty, Life, Health · Verify on NAIC SBS
- Lendmire LLC · Firm NMLS# 2371349 · Verify firm licensure
Compliance and disclosures. Lendmire (NMLS# 2371349) is a licensed mortgage broker and is not a direct lender, depository institution, financial advisor, or tax professional. Content in this article is general market analysis and educational information — not financial, legal, or tax advice for any specific situation. Lendmire does not guarantee loan approval; every transaction is subject to underwriting by the funding lender. Mortgage pricing and loan program guidelines are subject to change at any time without notice and vary by borrower characteristics, property type, and state regulations. Lendmire complies with Equal Housing Opportunity. Licensure verification: NMLS Consumer Access.