
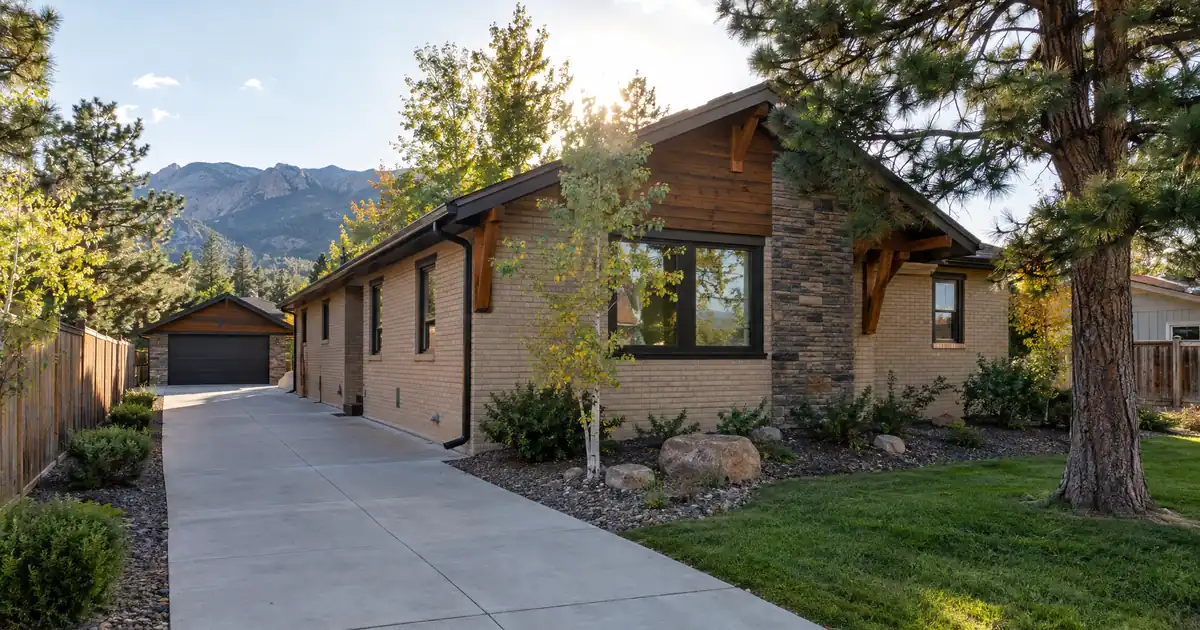
Picture an investor holding a four-unit building near 72nd Avenue and Raleigh Street, bought at $610,000 a few years back. The appraisal now comes in above that basis, the rents have held steady, and there’s a second property on the shortlist. The question isn’t whether equity exists. It’s how much of it a DSCR cash-out will release once the rent is measured against the full monthly obligation, and what has to stay true over the next 6-24 months for that answer to hold.
Lendmire (NMLS# 2371349), a DSCR-focused mortgage broker, helps arrange DSCR financing for Westminster, Colorado investors through wholesale and investor-lending channels across 41 markets, including Washington, D.C. This piece covers the extraction side of the ledger only: appreciation, seasoning, leverage caps, and which Westminster property types turn equity into usable capital.
DSCR Cash-Out Calculator
Run the cash-out numbers in Westminster, CO
Rate source: Freddie Mac 30-yr average via FRED® — Federal Reserve Bank of St. Louis · effective Sep 24, 2026
Prefilled with starting assumptions — enter your property’s value, balance, taxes, and insurance for a more accurate picture.
Program parameters update from Lendmire’s centralized guideline source. Taxes and insurance are editable estimates.
As of Sep 24, 2026 · General Freddie Mac market benchmark, not a Lendmire loan offer. Property value, balance, taxes, and insurance are editable estimates. Maximum loan-to-value varies by lender, program, property type, and seasoning. Not a Loan Estimate, approval, or commitment to lend. Program availability and eligibility are subject to lender guidelines, credit approval, property review, and underwriting.
TL;DR: DSCR cash-out refinancing in Westminster, Colorado fits investors who own two-to-four unit or attached rentals with equity to release, because the loan is underwritten primarily on the property’s rental income measured against its full monthly obligation, while detached houses priced near the citywide median tend to squeeze proceeds.
- Rail-corridor fourplex listing shows a 5.57 percent in-place cap rate (Redfin).
- Median sale price of $532,500 (Orchard) against median rent near $2,145 (Zumper) thins detached coverage.
- Cash-out typically caps at 75 percent LTV after about six months of seasoning.
- Prices are up 6.7 percent year over year while rent trend reads flat to negative depending on source.
Westminster Market Snapshot
A quick read on the Westminster investor landscape — figures come from the cited sources below. Confirm current property-level numbers before underwriting.
| Metric | Detail |
|---|---|
| Typical rents | $2,044 median gross (City-data.com Westminster) |
| Cap rates | 6.40% cap (Redfin Multi-Family Westminster) |
The Rail Corridor Is Where Multi-Unit Cash-Out Pencils
The Westminster Station and 72nd Avenue/Raleigh corridor is the strongest pocket for equity extraction. It combines light-rail access on the RTD B Line with the lowest entry-level apartment rents in the city, and it hosts the multi-unit product that stacks rent best against a single price basis.
The evidence is in the listings. A Marcus & Millichap-marketed four-unit property on Redfin is offered at roughly $800,000, showing a 5.57 percent in-place cap rate rising to 6.40 percent in year one. That’s an asking-price marketing figure, not a closed sale, so treat it as a ceiling on optimism. Homes.com separately describes a renovated four-unit building at 72nd and Raleigh, about a mile from the Westminster light rail station. On the rent side, Rent.com puts the average one-bedroom in the Westminster Station area at $1,300, the most affordable read in the city, though aggregator figures like this are directional only.
Run the numbers on a modeled fourplex of four two-bedroom units. Using Rentometer’s all-property two-bedroom average of $2,042, gross rent lands near $8,170 a month. That’s a modeled assumption built on one source’s averages, not a Westminster rent roll. At a value near the $800,000 ask and 75 percent LTV, coverage including taxes and insurance comes out north of 1.5x. Even with a healthy haircut to those rents, the number clears the standard 1.00x benchmark with room to spare.
Here’s the catch: supply. Redfin showed only seven multi-family units for sale in a month when condos numbered 112 and townhouses 80. Homes.com counted 12 multi-family listings priced from $280,000 to $995,000. Thin inventory means thin comps, and thin comps mean appraisal risk on any refinance that leans on a sale-price story.
Why Do Detached Houses Squeeze Proceeds?
Detached single-family rentals are the tightest fit for a DSCR cash-out in Westminster because price runs high relative to rent. Ocity reports a price-to-rent ratio of 23.2x against an 18x national average. That gap shows up directly in coverage.
Model a detached three-bedroom valued near the citywide median of $532,500 (Orchard’s figure; Ocity reads lower at $511,794 with a 3.1 percent year-over-year decline, reflecting different methodology). Rentometer’s three-bedroom average of $2,817 is the modeled rent. At 75 percent LTV including taxes and insurance, coverage lands around 0.9x. Below the baseline.
Rent barely moves with bedroom count. Rentometer shows $3,276 for four-plus bedrooms against $2,817 for three, so the larger house adds price faster than income. City-data.com points the same direction, reporting average detached values of $630,268 against $336,298 for three-to-four unit structures. Those are Census-derived per-structure averages, not per-building, so use them directionally. Small multifamily carries a much lower price basis.
A sub-1.00 file isn’t necessarily dead, but the structures that may apply are options a lender would review, not promises: a sub-1.00 program, interest-only restructuring, or lower leverage with more cash left in. Each usually brings compensating requirements, and eligibility depends on lender guidelines, credit, reserves, and property review. The cleaner move for most owners of detached houses is to size the loan to what today’s rent supports and treat any extra proceeds as a bonus.
Pocket by Pocket: Where Rent Comps Run Highest
Rent levels differ enough across Westminster that a citywide average is close to useless for underwriting. Redfin’s rental snapshot shows a citywide average of $1,748, but that figure is apartment-weighted. Its neighborhood medians tell a different story: $2,199 in West Westminster and $2,250 in Northeast Westminster, where Broadlands, McKay Landing, Red Leaf and Legacy Ridge sit.
Those two areas are the first places to test rent comps for any cash-out. Northeast Westminster’s newer housing stock also means less small multifamily to choose from, so the play there is usually attached product or a well-located detached rental with realistic coverage expectations.
Central Westminster offers mid-century homes and newer developments with US-36 and light rail access. Rent.com puts its one-bedroom average at $1,782. Downtown Westminster reads $2,003 on the same measure, and Orchard Town Center $2,032. The Orchard Town Center and Church Ranch area is mostly newer apartments and retail, and it’s likely a poor fit for multi-unit stacking. Skip it for this strategy.
Data gaps matter here. No reliable source surfaced for Westminster-specific duplex, triplex or fourplex rents, submarket rent-to-value ratios, or vacancy. Anything published on those points, including the modeled figures above, should be replaced with actual rent rolls and leases before a file goes to a lender.
The Tenant Base Behind the Rent Roll
Westminster’s renter demand rests on white-collar and healthcare employment rather than a college pipeline. Data USA lists the top resident sectors as professional, scientific and technical services (8,547 people), health care and social assistance (8,179), and retail trade (7,579). The City of Westminster names Trimble among its employers, and ColoradoBiz reports that Westminster-based Vantor (formerly Maxar) ranked No. 45 among mid-sized companies on Forbes’ best employers list. CommonSpirit’s St. Anthony North Hospital adds a healthcare anchor at 144th and I-25. Headcounts for these employers weren’t verifiable, so scale is qualitative here.
Household income reinforces the picture. Colorado Demographics shows median household income of $100,272, and Census Bureau QuickFacts counts 115,301 residents across 31.6 square miles. Student demand is modest and commuter-based, so don’t underwrite Westminster as a college-town rental market. Front Range Community College has a campus here, but that’s a supporting detail, not a thesis.
About 36 percent of households rent, per RentCafe, and Point2Homes reports two-bedroom units as the largest rental segment at 42 percent of the rentals it tracks (a subset, so the counts don’t reconcile with household totals). The practical read: duplex and triplex units with two-bedroom layouts match the biggest renter segment, which supports re-leasing and exit liquidity after the cash-out.
Appreciation Is Running Ahead of Rent
Prices and rents are sending different signals, and that divergence defines the extraction window. Orchard shows the median sale price up 6.7 percent year over year, with a 98.9 percent sale-to-list ratio. Ocity reads the other way, with a 3.1 percent decline against a 20.4 percent five-year gain. The sources conflict, so “elevated pricing, mixed short-term trend” is the honest description.
Rents are murkier still. Zumper shows median rent of $2,145, up about 4 percent over the year. RentCafe reports an average of $1,829, down 3.35 percent. Different property mixes explain some of the gap. Call the trend flat to modest growth and underwrite accordingly.
The implication is straightforward. Appraisals may support a meaningful cash-out, but coverage won’t improve on its own. Size the loan to today’s rent, not expected rent growth. This one is a toss-up on timing: appreciation-minded owners might wait for a stronger value read, while cash-flow owners with a clean rent roll may prefer to extract now while multi-unit comps are scarce and coverage is comfortable.
Indicators worth tracking over the next 6-24 months:
- Price cuts. Orchard shows 37.78 percent of listings carrying reductions. If that share climbs, appraisers lean on softer comps.
- Multi-family supply. A handful of listings means one distressed sale can reset the comp set.
- Rent divergence. If aggregator rents turn decisively negative, the coverage cushion on the fourplex math narrows.
- Days on market. Orchard shows 13 days, while the secondary source Ownify reports 35 days and 2.5 months of supply. The gap itself says the market isn’t uniformly tight.
Six Months, 75 Percent, and What’s Left
The extraction mechanics are simple to state. Cash-out on an investment property typically caps at 75 percent LTV, with seasoning of about six months from title recording. Coverage generally needs to reach 1.00x on rent used for lender review against full obligation, credit tiers run from a 620 floor upward, and reserves are typically about six months of the monthly obligation. Loan amounts on standard programs go up to $3,000,000. Program terms vary by lender, and the guide “What Is a DSCR Loan” is worth reading before running a file. LLC-held rentals can qualify, subject to lender program eligibility.
The proceeds aren’t a fixed figure. They’re the lesser of what the 75 percent ceiling allows and what the rent used for lender review supports, after reserves. On the fourplex model, the LTV cap binds. On the detached-house model, coverage binds first, which is why owners of higher-basis single-family rentals see the smallest extraction. For a wider view of the trade-offs, see the guide “The Refi Options”.
Patterns from files in structurally similar suburban Front Range markets are consistent. The cleaner files from a documentation standpoint tend to come with a current lease for every unit and a fresh rent schedule that matches what appears on the appraisal. The common friction point is a value that lands below the owner’s expectation because comps are sparse, which reduces proceeds before coverage even enters the picture. Owners who ask for a realistic value range first, then decide whether to refinance, tend to avoid the worst surprises.
Investors should also verify current local rental rules, taxes and insurance with qualified local professionals before committing to a plan. Anyone weighing a Westminster file can review Lendmire’s Colorado DSCR platform or see how the math pencils on a specific property, or call 828-256-2183.
Frequently Asked Questions
Which Westminster property type gives the largest cash-out?
Two-to-four unit properties near the rail corridor, because several rent streams sit against one price basis. Modeled coverage on a fourplex can run well above 1.5x including taxes and insurance, so the 75 percent LTV cap usually binds before coverage does. Detached houses near the median price tend to hit the coverage limit first.
DSCR vs. conventional financing
Two common ways to finance an investment property in Westminster, CO. They qualify you differently — here’s how investors weigh them.
Why investors choose it
- Qualifies on the property’s rental income — no personal tax returns, W-2s, or pay stubs needed to document income.
- No personal debt-to-income ceiling to clear, so existing mortgages and obligations don’t cap your borrowing the same way.
- Can be closed in an LLC, keeping the property inside a business entity.
- Built for scaling — not held to the limit on number of financed properties that conventional financing applies.
- Underwriting centers on the deal: generally qualifies when the rent covers the payment, a 1.00x coverage ratio being a common baseline (confirmed in underwriting).
- Designed specifically for investment property, including long-term and, where the program allows, short-term rentals.
Where it’s strong
- Often the lowest ongoing financing cost for a buyer who fully qualifies on personal income — a fit for a first property or a cost-first purchase.
Trade-offs for investors
- Requires full personal income documentation and must fit within a debt-to-income limit — salary, existing debts, and other mortgages all count.
- Typically held in your personal name rather than a business entity.
- Caps how many financed properties you can carry, which can become a ceiling as a portfolio grows.
- Evaluates you as a borrower as much as the property, which usually means more paperwork.
How investors usually choose: a first or single property often optimizes for the lowest financing cost; portfolio builders often optimize for leverage, vesting in an LLC, and scaling past conventional caps. The right answer depends on your goals, the property, and current guidelines — both paths run through select lenders in Lendmire’s wholesale network, with eligibility and terms confirmed in underwriting.
Does the six-month seasoning clock start at purchase or at recording?
It’s measured from title recording, and it’s typically about six months of ownership. Lenders may treat properties with recent renovations differently on value, so an owner who rehabbed a corridor fourplex should ask how the appraisal handles improvement costs.
Are the Westminster rent figures reliable enough to underwrite from?
Not on their own. Aggregators disagree, with averages ranging from about $1,586 to $2,145 depending on property mix, and no vacancy data surfaced. Actual leases and a current rent schedule carry far more weight than any published median.
Can a Westminster investor cash out on an eight-unit workforce building?
Usually not through a DSCR program. Properties with five or more units generally fall under commercial financing rather than one-to-four unit DSCR guidelines, and a Marcus & Millichap-marketed eight-unit listing near West 74th Avenue is that kind of asset.
How does Westminster compare with Boulder for a DSCR cash-out?
Boulder, up US-36, carries a heavier price basis, which pressures coverage on almost any rental. Westminster’s rail-corridor multi-unit stock offers a lower basis and more income stacking per dollar of value, so for now the math favors Westminster, provided the property is a duplex through fourplex rather than a detached house.
About Lendmire
Lendmire is a DSCR-focused mortgage brokerage, NMLS# 2371349, placing investor loans across 41 markets, including Washington, D.C. Lenders generally review DSCR eligibility around a property’s rental income rather than personal income documentation, which suits LLC-held rentals, self-employed investors, and portfolios growing past conventional financed-property limits. The brokerage is recognized by Scotsman Guide as a 2026 Top Workplace and a 2025 Scotsman Guide Top Mortgage Workplace.
Get Started
Ready to find the right loan for you?
In about 30 seconds you can review financing options available for your investment property. No commitment required.
Informational only. Not a Loan Estimate, approval, or commitment to lend. Program availability and eligibility are subject to lender guidelines, credit approval, property review, and underwriting.
References
1. Redfin
2. Orchard
3. Zumper
5. Homes.com
6. Rent.com
7. Rentometer’s
8. Ocity
10. Data USA
12. ColoradoBiz
13. CommonSpirit’s St. Anthony North Hospital
16. Front Range Community College
17. RentCafe
18. Point2Homes
19. Ownify
20. recognized by Scotsman Guide as a 2026 Top Workplace
21. a 2025 Scotsman Guide Top Mortgage Workplace
This article is part of Lendmire’s investment property cash-out refinance program — full qualification details, guidelines, and scenarios live on the program page.
Related reading: Cash Out Refinance Investment Property Westminster Colorado · Cash Out Refinance Investment Property Vail Colorado · Cash Out Refinance Investment Property Aspen Colorado
Guides: Investment Property Cash-Out Refinance in Westminster, CO · Investment Property Cash-Out Refinance in Colorado
Brandon Miller
Founder & CEO, Mortgage Loan Originator, Lendmire LLC
- Mortgage Loan Originator · NMLS# 1129696 · Verify on NMLS Consumer Access
- North Carolina Real Estate Broker · License# 343312 · Verify on NCREC
- North Carolina Insurance Producer · License# 19053198 · Property, Casualty, Life, Health · Verify on NAIC SBS
- Lendmire LLC · Firm NMLS# 2371349 · Verify firm licensure
Important disclosures. Lendmire (NMLS# 2371349) is a licensed mortgage brokerage. Lendmire is not a direct lender, depository institution, or financial advisor. All loan inquiries are subject to lender underwriting; this article does not constitute a commitment to lend. Rates, terms, and program guidelines are subject to change without notice and vary by borrower profile, property type, and state. Information in this article is general in nature and is not financial, legal, or tax advice. Equal Housing Opportunity. NMLS Consumer Access: nmlsconsumeraccess.org.