
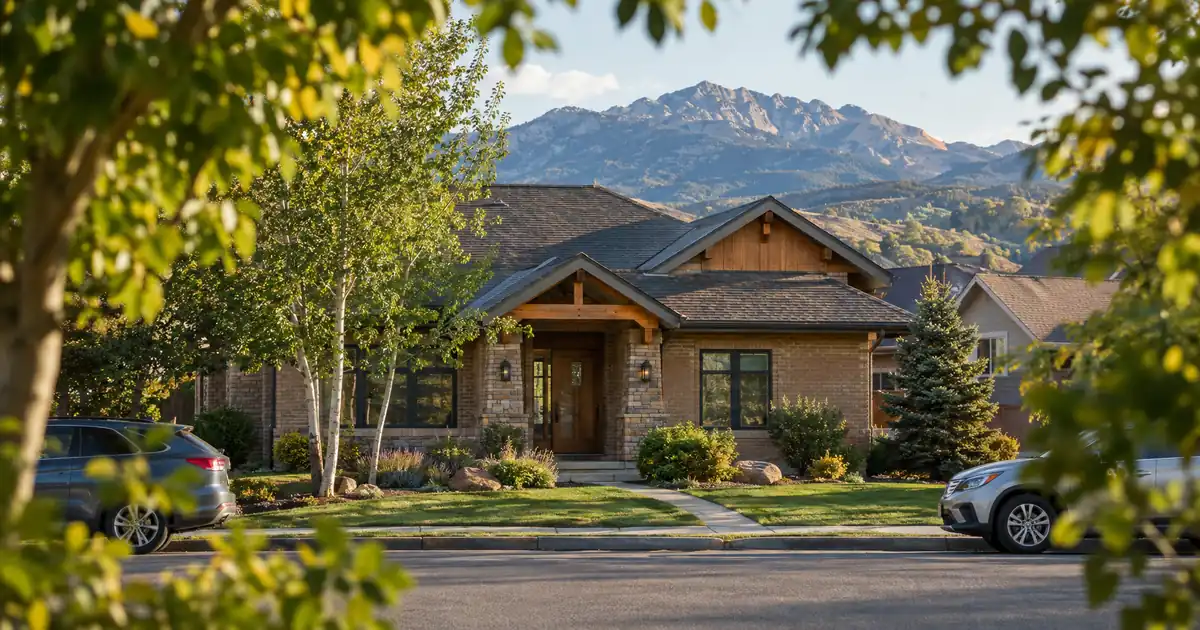
Drive the school corridor near Loveland High School and Taft Avenue in Southwest Loveland and you’ll see the tenant base that keeps this submarket steady: manufacturing and engineering workers renting three-bedroom houses within a short commute of their employers. If you bought one of these properties a few years ago, the conversation has changed. You’re no longer asking what it will cost to get in. You’re asking how much of the equity can come out, and what it can fund next.
At a Glance: A DSCR cash-out refinance in Loveland, Colorado is underwritten primarily on the property’s rental income measured against its full monthly obligation, which makes a market with 6.6 percent rental vacancy and no new deliveries a steady place to seat a refinance.
DSCR Cash-Out Calculator
Run the cash-out numbers in Loveland, CO
Rate source: Freddie Mac 30-yr average via FRED® — Federal Reserve Bank of St. Louis · effective Sep 24, 2026
Prefilled with starting assumptions — enter your property’s value, balance, taxes, and insurance for a more accurate picture.
Program parameters update from Lendmire’s centralized guideline source. Taxes and insurance are editable estimates.
As of Sep 24, 2026 · General Freddie Mac market benchmark, not a Lendmire loan offer. Property value, balance, taxes, and insurance are editable estimates. Maximum loan-to-value varies by lender, program, property type, and seasoning. Not a Loan Estimate, approval, or commitment to lend. Program availability and eligibility are subject to lender guidelines, credit approval, property review, and underwriting.
- Cash-out leverage tops out at 75 percent of value, with about 6 months of ownership typically required first.
- Loveland’s 6.6 percent vacancy compares with 9.7 percent in Fort Collins and 11.6 percent in Longmont.
- Duplex-style income stacking clears full-carry coverage more easily than single-family at the same leverage.
- Centerra new construction is appreciation-led. Older neighborhoods fit cash-flow underwriting better.
Loveland Market Snapshot
A quick read on the Loveland investor landscape — figures come from the cited sources below. Confirm current property-level numbers before underwriting.
| Metric | Detail |
|---|---|
| Home prices | $501,662 average home value (Zillow Home Value Index) |
| University enrollment | ~16,000 students (Thompson School District “Your) |
| Vacancy | 6.6% (RPM Rockies) |
Equity in a Flat-Price Market: What You’re Actually Extracting
Loveland equity is a story of purchase-era basis, not recent price momentum. Zillow’s Home Value Index puts the average Loveland home value at $501,662, down 1.1 percent over the past year. Redfin data cited by a local brokerage blog shows the median sale price near $475,000, down roughly 3.1 percent. The two sources use different methodologies, so read them as a range: flat to slightly soft.
That changes how you plan. If you bought before recent price levels settled in, your equity is real but it isn’t growing on autopilot. Extracting it means a new appraisal, and the appraisal has to hold.
The comp set helps. Redfin’s Loveland data shows homes spending about 51 days on the market and drawing two offers, with active sales across Lakes at Centerra, Downtown Loveland, Rural Southwest Loveland, Boyd Lake and West Lake. Five actively transacting pockets give an appraiser plenty of closed sales to reference. A market with one thin pocket would be a tougher appraisal.
The program framework is straightforward. The standard guideline is a 75 percent LTV ceiling on cash-out, typically after about 6 months of ownership measured from title recording. Whatever the appraisal says, the proceeds depend on rent used for lender review, the full monthly obligation (principal, interest, taxes, insurance and any HOA dues), reserves and that 75 percent cap. Nobody can promise you a cash figure before the file is reviewed, and eligibility stays subject to lender guidelines. Lendmire’s DSCR cash-out refinance page walks through the mechanics.
Why the Rent Side Holds Up
Loveland’s rental fundamentals are the reason lenders will look at the rent figure with confidence. The RPM Rockies market page, sourced to CoStar, reports 6.6 percent rental vacancy, 12-month asking rent growth of 2.6 percent and 285 units absorbed over a year with zero new deliveries. That’s a demand surplus with no fresh supply competing for your tenant. Vacancy in Loveland sits well below the neighboring Front Range markets of Fort Collins and Longmont, which run higher.
Who is renting? Start with the employers. Thompson School District is the largest employer in Loveland and Berthoud, with roughly 16,000 students across 32 schools. UCHealth Medical Center of the Rockies at Centerra is a 216-bed Level I trauma center, and a directory listing shows 678 practicing providers there. Hach Company keeps its global headquarters in Loveland, with research laboratories, instrument manufacturing and a technical training center. The Northern Colorado Economic Alliance notes no single industry exceeds 15 percent of the local market. That diversity matters when you’re sizing a long-hold refinance. A single-plant layoff can’t empty a whole neighborhood.
Working DSCR brokers see a recurring pattern in commuter-belt markets like this one: the rent side of the file rarely causes trouble, while the valuation and carry side does. Borrowers often anchor on rent growth and forget that coverage is measured against the full monthly obligation at the new, larger loan balance. The files that move smoothly are the ones where the investor pressure-tests coverage at the cash-out balance before ordering the appraisal, not after.
Fort Collins spillover adds another layer. Loveland sits about 12 miles from Colorado State University’s main campus, and the Alliance profile lists CSU as the region’s top employer at 7,945 employees on or near campus. Loveland gets workers who want lower acquisition prices and a short drive north or south on US-34.
Run the Numbers: Single-Family vs. Duplex at 75 Percent
Here’s where equity extraction gets honest. The table below uses modeled assumptions, not market quotes: a 30-year amortization, taxes and insurance included in the monthly obligation, and coverage rounded down. Values and rents are assumptions chosen inside Loveland’s observed bands. The brief’s single-family range runs $380,000 to $490,000 in price and $1,800 to $2,400 in rent.
| Modeled scenario | Value | Rent | Coverage (full carry) |
|---|---|---|---|
| Mid-band SFR, 75% LTV | $450,000 | $2,100 | about 0.80 |
| Low-price, high-rent SFR, 75% LTV | $400,000 | $2,400 | about 1.00 |
| Duplex, 75% LTV | $500,000 | $3,400 | about 1.15 |
The pattern is clear. A single-family rental in the middle of Loveland’s price band lands below 1.00 at maximum cash-out leverage once taxes and insurance are in. Only the low-price, high-rent corner gets near the benchmark. A duplex with two units near $1,700 each, in line with a downtown-area duplex listing showing one unit leased at that level, clears it with cushion. (That $3,400 combined figure is an assumption that both units rent alike, and it should be confirmed against actual leases.) Every figure here varies by lender and program — guidelines, property type, leverage, and credit profile all apply.
Most standard programs are built around a 1.00 benchmark, since that’s where rent covers the obligation. Some lenders review lower ratios, though those files usually call for stronger compensating factors, lower leverage or more cash in the deal. Exact eligibility depends on lender guidelines, credit, reserves and property review. For the mechanics, the DSCR fundamentals page covers how the ratio is built.
What’s the Catch on Sub-1.00 Files?
The catch is that your cash-out amount, not your rent, becomes the binding constraint. A single-family owner modeling around 0.80 has options a lender would review: a lower LTV so the new balance shrinks, an interest-only structure, or a sub-1.00 program that accepts thinner coverage with compensating strengths. Each comes with tradeoffs in leverage, pricing or cash required, and none is guaranteed. Eligibility review depends on credit approval, reserves and property review.
This one’s a real toss-up. Dropping leverage gets the ratio up but pulls less cash out, which can defeat the reason to refinance. Taking the sub-1.00 route preserves proceeds but typically asks for more from the rest of the file. The better play depends on what the cash is for. If it funds a duplex that itself covers at 1.15, accepting thinner coverage on the original house can be a reasonable trade.
Rent Signals Across Loveland Neighborhoods
Loveland’s rent spread by neighborhood is wide. Rent.com shows average one-bedroom apartment rents that run from $1,425 in Southwest Loveland and Northwest Mountain View up to $2,783 in Mountain View. These are apartment figures, not single-family rents, so treat them as relative signals.
| Neighborhood | Avg. 1BR rent | Read |
|---|---|---|
| Southwest Loveland – Thompson | $1,425 | Affordable, school-corridor base |
| Northwest Mountain View | $1,425 | Affordable residential |
| Downtown Loveland | $1,555 | Historic core, arts district |
| Southeast Loveland | $1,781 | Mid-tier |
| Mountain View | $2,783 | Top of the range |
For DSCR purposes the spread means you should model your own submarket’s rent and never a citywide average. A property in the Mountain View pocket can carry meaningfully higher coverage than an identical unit in Southwest Loveland at a similar value. Citywide aggregators disagree anyway. RentCafe shows an average near $1,900, Zillow Rental Manager a median of $1,923 and Zumper an average near $1,650.
DSCR vs. conventional financing
Two common ways to finance an investment property in Loveland, CO. They qualify you differently — here’s how investors weigh them.
Why investors choose it
- Qualifies on the property’s rental income — no personal tax returns, W-2s, or pay stubs needed to document income.
- No personal debt-to-income ceiling to clear, so existing mortgages and obligations don’t cap your borrowing the same way.
- Can be closed in an LLC, keeping the property inside a business entity.
- Built for scaling — not held to the limit on number of financed properties that conventional financing applies.
- Underwriting centers on the deal: generally qualifies when the rent covers the payment, a 1.00x coverage ratio being a common baseline (confirmed in underwriting).
- Designed specifically for investment property, including long-term and, where the program allows, short-term rentals.
Where it’s strong
- Often the lowest ongoing financing cost for a buyer who fully qualifies on personal income — a fit for a first property or a cost-first purchase.
Trade-offs for investors
- Requires full personal income documentation and must fit within a debt-to-income limit — salary, existing debts, and other mortgages all count.
- Typically held in your personal name rather than a business entity.
- Caps how many financed properties you can carry, which can become a ceiling as a portfolio grows.
- Evaluates you as a borrower as much as the property, which usually means more paperwork.
How investors usually choose: a first or single property often optimizes for the lowest financing cost; portfolio builders often optimize for leverage, vesting in an LLC, and scaling past conventional caps. The right answer depends on your goals, the property, and current guidelines — both paths run through select lenders in Lendmire’s wholesale network, with eligibility and terms confirmed in underwriting.
Southwest Loveland is where the workforce thesis is cleanest. Tenant demand there ties to manufacturing and engineering jobs, and the school corridor keeps three-bedroom houses occupied. No independent source confirms submarket-level coverage figures here, so the math stays qualitative, but the tenant profile suits a long-hold refinance. Downtown is the other place to look, because redevelopment-oriented areas near it are where duplexes, triplexes and selective small multifamily realistically sit. You also won’t find many multi-unit acquisitions scattered through detached-home neighborhoods. If you already own a single-family house with room for an ADU, that’s the other income-stacking route, though lenders treat that income according to program terms.
Centerra Is a Hold, Not a Cash-Out Play
New construction at Centerra prices well above the band where Loveland’s DSCR math works. Kinston at Centerra lists 32 homes from $640,000 to $675,000. Local buyer guides note that Centerra and some southwest communities carry price points and added carrying costs that rival pricier northern markets.
That’s appreciation and lifestyle territory. Coverage at acquisition is weaker, and the equity you might extract depends on resale value holding up in a flat market. If cash flow is the goal, older neighborhoods (Downtown, Southwest, West Central) fit the $380,000 to $490,000 band where rents actually support the file. Keep Centerra for the long-hold refinance thesis, not the near-term cash-out.
Where the Proceeds Go
The 75 percent ceiling and the reserve requirement (about 6 months of the full monthly obligation, rising to about 9 months above $1,500,000) mean you’re paying for liquidity on the way out. Credit tiers typically run 620, 660, 680 and 700, with 620 as the floor. Standard programs go up to $3,000,000, and smaller balances route through select lenders in the network. Loans to LLC-titled borrowers are subject to program terms, so confirm how your vesting is treated before ordering the appraisal.
Consider a scenario where an investor pulls proceeds from a seasoned Southwest Loveland house and puts them toward a downtown-area duplex. The refinance has to clear coverage on its own, and the new purchase then has to clear it too. That’s two files, each reviewed separately. Comparing the programs shows why investors in this position lean on property income rather than personal income documentation, and the details of refinancing cover the wider range of refinance structures.
Lendmire works with Loveland, Colorado investors through a DSCR program footprint spanning 40 states plus Washington, D.C., and Lendmire’s NMLS# is 2371349. For the state-level view, see Lendmire’s Colorado DSCR platform. If you’d like to see how your own numbers land, review my scenario or call 828-256-2183. As always, have a local attorney, CPA and insurance professional confirm current Loveland rental rules, taxes and insurance before you transact.
Frequently Asked Questions
How do you qualify for a DSCR loan in Loveland?
Qualification centers on the property’s rent relative to its full monthly obligation, with 1.00 the common baseline. Lenders also review credit (typically a 620 floor, with better tiers at 660, 680 and 700), reserves near 6 months and the appraised value. Since Loveland rents often land between $1,800 and $2,400 for single-family homes, the ratio depends heavily on price and leverage. Final eligibility is subject to lender guidelines.
What are the requirements for an investment property cash-out refinance in Loveland, Colorado?
Expect about 6 months of ownership from title recording, a maximum 75 percent LTV, a minimum 1.00 coverage benchmark and reserves of about 6 months. Loan amounts generally go up to $3,000,000 on standard programs. Manufactured homes, log homes and barndominiums fall outside these programs. Equity available is never a guaranteed figure.
Does Loveland’s flat pricing make a cash-out refinance harder?
Somewhat, yes. Zillow shows average values slipping slightly and Redfin shows the median down by a modest amount, so you can’t count on appreciation to create equity. Your proceeds depend on the gap between your loan balance and a conservative appraisal. The five actively transacting submarkets give appraisers solid comps, which helps.
Is a duplex or single-family home easier to refinance in Loveland?
Duplexes generally clear coverage more easily. Modeled at 75 percent leverage with full taxes and insurance, a duplex with combined rent near $3,400 lands around 1.15, while a mid-band single-family home sits closer to 0.80. The tradeoff is fewer duplex options, mostly near downtown and redevelopment areas.
Can a self-employed investor buying in Loveland be reviewed for DSCR financing?
Yes. Lendmire arranges DSCR investor loans. Because the file is reviewed primarily on the property’s rental income instead of traditional personal-income documentation, self-employed borrowers are a natural fit, subject to lender guidelines and credit approval.
For current guidelines and terms, see Lendmire’s DSCR loan programs page.
Get Started
Ready to find the right loan for you?
In about 30 seconds you can review financing options available for your investment property. No commitment required.
Informational only. Not a Loan Estimate, approval, or commitment to lend. Program availability and eligibility are subject to lender guidelines, credit approval, property review, and underwriting.
About Lendmire
A DSCR-focused mortgage broker, Lendmire (NMLS# 2371349) places investor financing across 41 markets, 40 states plus Washington, D.C., with eligibility generally reviewed by the lender on property cash flow rather than traditional personal-income documentation, subject to lender guidelines. Scotsman Guide recognized Lendmire as a 2025 Scotsman Guide Top Workplace and a 2026 Scotsman Guide Top Mortgage Workplace, as covered in the 2026 Top Workplace recognition announcement.
Loveland’s 6.6 percent vacancy and zero-delivery pipeline favor owners who already hold a seasoned house near Hach, the school corridor or Centerra’s medical campus, so is your equity sitting in a single-family home that barely covers, or in a duplex-style asset that could fund the next Loveland purchase?
This article is part of Lendmire’s investment property cash-out refinance program — full qualification details, guidelines, and scenarios live on the program page.
Related reading: Luxury Rental DSCR Loans In New Jersey · Jersey Shore Vacation Rental Loans: DSCR Financing In Ocean City, Cape May And Long Beach Island · DSCR Cash-out Refinance In New Jersey: Pulling Equity From A Rental
Guides: Investment Property Cash-Out Refinance in Loveland, CO · Investment Property Cash-Out Refinance in Colorado
Brandon Miller
Founder & CEO, Mortgage Loan Originator, Lendmire LLC
- Mortgage Loan Originator · NMLS# 1129696 · Verify on NMLS Consumer Access
- North Carolina Real Estate Broker · License# 343312 · Verify on NCREC
- North Carolina Insurance Producer · License# 19053198 · Property, Casualty, Life, Health · Verify on NAIC SBS
- Lendmire LLC · Firm NMLS# 2371349 · Verify firm licensure
Required disclosures. Lendmire (NMLS# 2371349) operates as a licensed mortgage broker, not a direct lender or depository. The discussion in this article is general in nature and should not be relied upon as financial, legal, or tax advice — every investment scenario is unique and should be reviewed by a qualified professional. Any loan inquiry is subject to lender underwriting, and this article is not a commitment to lend or a guarantee of approval. Mortgage rates, loan terms, and program guidelines vary by borrower, property, and state, and may change without notice. Equal Housing Opportunity. Verify licensure at NMLS Consumer Access.