
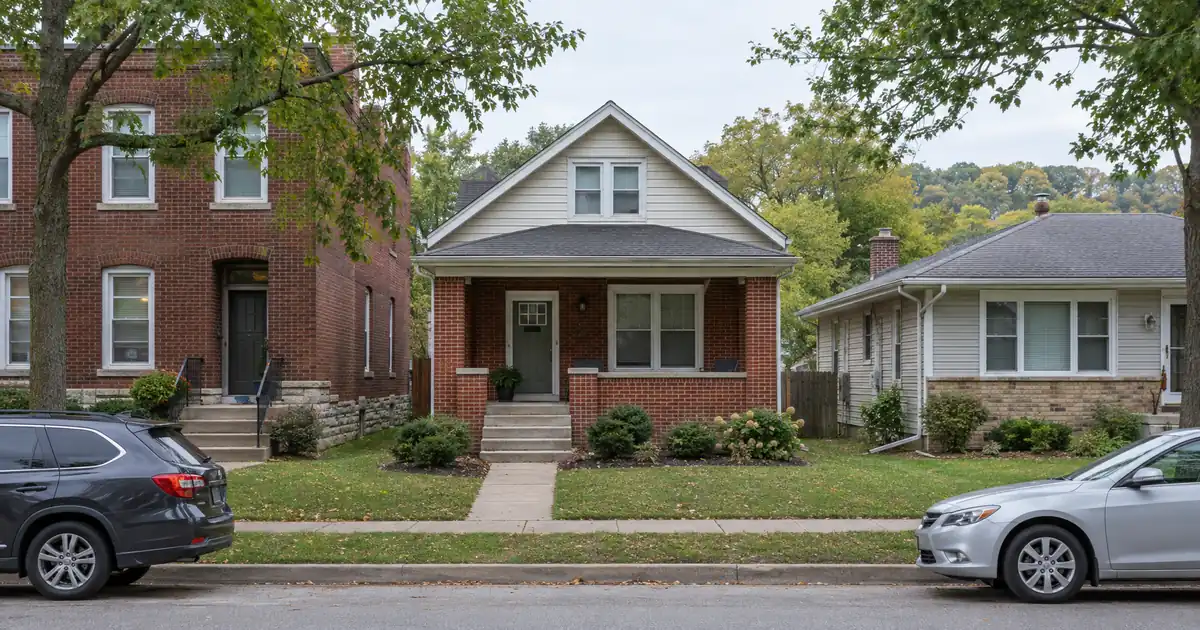
An out-of-state investor scrolling St. Charles listings sees a brick-paved Main Street, the Katy Trail one block east of it, and a typical home value that Zillow puts at $296,834, up 1.9% over the past year. It looks like a calm, appreciating river town. A DSCR cash out refinance in St Charles, Missouri is a different question from the purchase, though. The investor already owns the asset, so the real questions are what the appraiser will say the rent is, how much of the value is reachable under a 75% leverage cap, and whether the proceeds can go somewhere that pencils. Exact terms depend on the lender’s guidelines, property type, leverage, and a full review of the borrower’s file.
DSCR Cash-Out Calculator
Run the cash-out numbers in St Charles, MO
Rate source: Freddie Mac 30-yr average via FRED® — Federal Reserve Bank of St. Louis · effective Sep 24, 2026
Prefilled with starting assumptions — enter your property’s value, balance, taxes, and insurance for a more accurate picture.
Program parameters update from Lendmire’s centralized guideline source. Taxes and insurance are editable estimates.
As of Sep 24, 2026 · General Freddie Mac market benchmark, not a Lendmire loan offer. Property value, balance, taxes, and insurance are editable estimates. Maximum loan-to-value varies by lender, program, property type, and seasoning. Not a Loan Estimate, approval, or commitment to lend. Program availability and eligibility are subject to lender guidelines, credit approval, property review, and underwriting.
The Short Version:
A cash-out refinance on a St Charles, Missouri rental is underwritten primarily on the property’s rental income measured against its full monthly obligation, so the deal works from title-recorded ownership and an appraiser’s rent schedule to a leverage cap and reserve check, with the lender confirming each piece before the proceeds are released.
- Typical home value sits near $296,834 per Zillow, rising roughly 2% a year.
- Median gross rent near $1,380 makes median-priced single-family cash-outs a leverage exercise.
- Cash-out is capped at 75% LTV after about 6 months of ownership, subject to lender guidelines.
- Duplexes near Old Town and Lindenwood carry the strongest per-door coverage angle.
Lendmire (NMLS# 2371349) is a DSCR-focused mortgage broker, and St Charles, Missouri investors can have DSCR scenarios reviewed through lender programs that Lendmire helps place across 41 markets, including Washington, D.C. Investors comparing state-level options can start with Lendmire’s Missouri DSCR platform.
St Charles Market Snapshot
A quick read on the St Charles investor landscape — figures come from the cited sources below. Confirm current property-level numbers before underwriting.
| Metric | Detail |
|---|---|
| Recent appreciation | +1.9% yoy (Zillow Home Values) |
| University enrollment | 6,826 students (Lindenwood) |
Old Town and Frenchtown: Where the Duplex Math Lives
Old Town (ZIP 63301) is the strongest cash-out submarket in the city for an investor holding small-format stock. Homes.com describes housing that runs from historic Greek Revival properties to vinyl-sided houses and early-1900s cottages. The tenant base is hospitality workers along Main Street and Frenchtown, plus renters who want proximity to Lindenwood. Discover St. Charles notes the Katy Trail, a 240-mile former rail route, runs one block east of Main Street. That amenity supports demand without depending on any single employer.
The research doesn’t support neighborhood-level prices or rents here, so treat the following as modeled, not sourced. Say an investor owns a duplex in Old Town valued at $400,000 (a modeled assumption), with two 2-bedroom units. RentCafe’s Yardi Matrix data shows $1,519 for a 2-bedroom, but it covers only buildings with 50+ units, so it is a ceiling for small stock. Underwrite each door at $1,350 instead. At 75% LTV, modeled on full PITIA including taxes and insurance, that lands in the low 1.1s. Use the RentCafe figure and it climbs to about 1.2x. Either way it clears the 1.00 benchmark that most standard programs build around, subject to lender guidelines.
Why does this work when single-family often doesn’t? Rent scales per door while the loan is priced on the whole building. A duplex only has to be bought at a per-door price below single-family levels. Old Town’s older stock is where that happens.
The catch is scarcity. RentCafe reports that 93% of rental communities in the city are low-rise garden-style complexes, so 2-4 unit comps are thin. An appraiser working with few rent comparables may land conservatively.
Lindenwood, First Capitol Drive, and the Staff-and-Student Pocket
Lindenwood University is the second demand anchor, and it sits inside the city limits. Lindenwood was founded in 1832 and enrolls 6,826 students, with 4,663 undergraduates and 2,163 postgraduates. Upper-class students, graduate students, and staff rent off campus, concentrated near First Capitol Drive and Highway 94. The city’s own reports describe University Commons as a retail center across that corridor from the campus.
The lease pattern here favors a cash-out. Students and university staff turn over on academic calendars, but the enrollment base is large enough that a well-located 3-4 bedroom or a duplex tends to re-let. Lenders will want the lease in hand or a market-rent appraisal.
Broader employment support comes from the county. The Economic Development Council of St. Charles County says the county captured 44% of all new job growth in the St. Louis metro between 2012 and 2022 and cites nearly 10,000 employers. City-level employers include SSM Health St. Joseph Hospital in town, LMI Aerospace on Highway 94, and the county and city governments. Barnes-Jewish St. Peters and Progress West sit in adjacent cities and work as commuter-shed employers. No verified headcounts were found for most of these, so the point is diversity, not size. The city’s population is 72,458 by the latest estimate.
The Single-Family Cash-Out Problem
The median-priced single-family rental is where cash-out files run into trouble. The all-unit median gross rent per City-Data is $1,380. Apartment List’s median of $1,337 is lower and reflects a different methodology. Against a $296,834 typical value, that is a thin rent-to-price ratio.
Run the numbers on a modeled $300,000 three-bedroom house at 75% LTV, with full PITIA including taxes and insurance. If it rents at the RentHop listing-based average of about $1,950 for a 3-bedroom, coverage lands right around 1.0x to 1.05x. At RentCafe’s $1,901, it sits closer to 1.0x. Trim leverage to 70% LTV and the same house moves to roughly 1.1x. Every figure here varies by lender and program — guidelines, property type, leverage, and credit profile all apply.
Now bump the value. Rocket Homes’ older median sold price of $330,000 reflects a sold-price methodology, and on a house at that value with the same $1,950 rent, coverage slips just under 1.00x.
When the number sits below 1.00, the structures a lender would review include a sub-1.00 program at reduced leverage, an interest-only period, or a lower LTV that resizes the loan. Each carries tradeoffs: more cash left in the deal, stronger credit and reserves, and different pricing. Qualification is subject to lender guidelines, credit approval, and property review. If the investor keeps reaching for sub-1.00 on every single-family in the portfolio, that’s a signal to reconsider what’s being held, not to keep hunting for a looser structure.
DSCR files in markets like this one typically look like this: the borrower’s own rent estimate runs well above the appraiser’s, because listing-site rents in a market with newer-build competition skew high. The files that go smoothly usually start with a conservative rent assumption and an early look at comparable leases. Files that stall are often the ones where the investor sized the cash-out on a listing-site rent and had to re-size after the appraisal.
For the mechanics, here is how DSCR coverage is calculated: monthly rent divided by the full monthly obligation, including principal, interest, taxes, insurance, and any HOA dues.
Promenade Concessions
One month free at Promenade at New Town. That’s the data point.
Redfin’s 63301 listings show newer-build concessions in the New Town and riverfront corridor, and the supply there is institutional. Single-family rentals in the same area compete with it directly. Older stock in Old Town competes less, but a concession in a new building can cap what an appraiser will call market rent nearby.
The gap between sources is real. Apartment List has $1,337, Redfin’s average rent is $1,355, RentHop’s listing median is $1,925, and Zillow’s figure is stale. That spread matters because a lender’s appraised market rent may land well below a listing-site estimate. Underwrite to the low end, confirm with a rent schedule, and treat anything above it as upside.
Apartment buildings in the city average about 34 years old, per RentCafe. Older stock is the norm, which is why newer concessions stand out and why an older duplex has to earn its rent on location and condition.
What Does Equity Look Like at Roughly 2% Appreciation?
Appreciation here is slow and steady, not explosive. Zillow shows +1.9% year over year for the city, and its county figure of $368,403 is up 2.3%. Movoto’s median list price of $399K is a listing price, not a sale price, so it says more about seller expectations than realized value.
Two consequences follow. First, drift alone rarely builds a cash-out. Equity that supports a meaningful draw at a 75% LTV cap usually comes from a below-market basis, a value-add renovation, or a long hold. Seasoning applies too: lenders typically look for about 6 months of ownership, measured from title recording, before a cash-out on a purchased property.
Second, the thesis depends on where the proceeds go. Pulling equity to buy another duplex in Old Town or near Lindenwood, where coverage still clears at current pricing, is a straightforward argument. Pulling equity to fund out-of-state deals that don’t pencil is a different decision, and one worth stress-testing before committing.
Thinking out loud here: for an investor holding a single-family with borderline coverage, the better move might be holding it as-is and using proceeds from a different asset. A cash-out on a marginal file can cost more in leverage and cash left in than the proceeds are worth. That’s a genuine toss-up, and it depends on the next deal.
Conventional financing might be the right call instead if the investor is a W-2 borrower with one or two financed properties and clean personal income documentation. DSCR becomes more practical for entity-held portfolios, self-employed investors, or anyone at four or more financed properties. The guide “Where DSCR and Conventional Diverge” is worth reading before choosing a lane. For the mechanics of the program itself, see Lendmire’s DSCR cash-out refinance and the investor refinance breakdown.
The Paper Trail (Where Files Slow Down)
Cash-out files in a suburban single-family market like this one tend to stall on documentation, not on coverage. The list is short but strict:
- Ownership timeline. The title recording date drives seasoning. If the property was acquired through an entity or a quitclaim, expect additional review.
- Appraisal with rent schedule. The rent conclusion on the appraisal usually controls the coverage number, not the lease. With thin 2-4 unit comps in a city where 77% of households own, ask the appraiser early what comps are available.
- Leases. Current leases support the appraisal’s rent. Month-to-month tenancies or below-market family leases invite questions.
- Reserves. Programs typically look for about 6 months of PITIA in liquid reserves (about 9 months above $1,500,000).
- Credit. Tiers commonly step at 620, 660, 680, and 700, with a floor of 620. Leverage and pricing usually improve as score climbs.
- Vesting. LLC-titled borrowers are common, subject to lender program eligibility.
- Insurance evidence. A current hazard policy is part of the file. Budget for taxes and insurance, which vary by property, and verify current local rental rules, taxes, and insurance with qualified local professionals.
The county’s 5% rental vacancy figure per Affordable Housing Online is a reasonable planning assumption for a stabilized long-term rental, though it is directional and county-level, not a citywide or submarket number. Loan amounts on standard programs run up to $3,000,000, with smaller balances routed through select lenders in the network.
DSCR vs. conventional financing
Two common ways to finance an investment property in St Charles, MO. They qualify you differently — here’s how investors weigh them.
Why investors choose it
- Qualifies on the property’s rental income — no personal tax returns, W-2s, or pay stubs needed to document income.
- No personal debt-to-income ceiling to clear, so existing mortgages and obligations don’t cap your borrowing the same way.
- Can be closed in an LLC, keeping the property inside a business entity.
- Built for scaling — not held to the limit on number of financed properties that conventional financing applies.
- Underwriting centers on the deal: generally qualifies when the rent covers the payment, a 1.00x coverage ratio being a common baseline (confirmed in underwriting).
- Designed specifically for investment property, including long-term and, where the program allows, short-term rentals.
Where it’s strong
- Often the lowest ongoing financing cost for a buyer who fully qualifies on personal income — a fit for a first property or a cost-first purchase.
Trade-offs for investors
- Requires full personal income documentation and must fit within a debt-to-income limit — salary, existing debts, and other mortgages all count.
- Typically held in your personal name rather than a business entity.
- Caps how many financed properties you can carry, which can become a ceiling as a portfolio grows.
- Evaluates you as a borrower as much as the property, which usually means more paperwork.
How investors usually choose: a first or single property often optimizes for the lowest financing cost; portfolio builders often optimize for leverage, vesting in an LLC, and scaling past conventional caps. The right answer depends on your goals, the property, and current guidelines — both paths run through select lenders in Lendmire’s wholesale network, with eligibility and terms confirmed in underwriting.
Program terms shift, and all of the above is subject to lender overlays and borrower-specific review. Investors who want a file sized against real numbers can reach Lendmire at 828-256-2183 or request a scenario review.
Frequently Asked Questions
How do you qualify for a DSCR loan in St Charles, Missouri?
Qualification centers on the property’s rent against its full monthly obligation, with 1.00x a common baseline on standard programs. Some lenders review lower ratios with compensating factors such as lower leverage, stronger credit, or more reserves. Exact eligibility depends on lender guidelines, credit profile, property review, and state overlays.
What are the requirements for a cash-out refinance on an investment property in St Charles, Missouri?
Typically: about 6 months of ownership measured from title recording, an LTV ceiling of 75%, a coverage ratio at or above the program’s floor, and reserves of about 6 months of PITIA. The appraisal and rent schedule set the value and the rent used for lender review. The cash available depends on all of those, so it is never a guaranteed figure.
Does a duplex near Old Town usually appraise for enough rent?
Often, but the comps are the risk. Small multifamily is a niche in a city where renters are only 23% of households, per RentCafe’s tenure data, and its unit-size rents cover 50+ unit buildings. Underwrite below those figures and get the appraiser’s rent comps early.
Should I cash out on a single-family I bought near the median price?
It depends on rent. At a $1,380 median gross rent, a median-priced house usually needs lower leverage to clear 1.00x. A 3-bedroom at listing-level rents can clear on modeled math. Below that, weigh cash left in the deal against what the proceeds will earn elsewhere.
Can Lendmire help structure DSCR financing for small multifamily investment properties in St Charles?
Yes. Lendmire arranges DSCR investor loans through wholesale lending channels. Programs on small multifamily are evaluated primarily on the property’s rental income, subject to lender guidelines and property review.
The Number That Reframes the Market
St. Charles is one of the more owner-occupied suburbs an investor will underwrite: 77% of households own, and renters number just 13,313. That is the entire rental pool the city offers, which explains both the scarcity of small-multifamily comps and the pricing power of a well-located duplex.
For current guidelines and terms, see Lendmire’s DSCR loan programs page.
About Lendmire
Lendmire (NMLS# 2371349) is a mortgage brokerage focused on DSCR investor financing, helping arrange programs through wholesale and investor-lending channels in 41 markets, including Washington, D.C. DSCR loans are evaluated by the lender on property cash flow rather than personal income, subject to lender guidelines, supporting LLC closings and accommodating investors with four or more financed properties. Scotsman Guide named Lendmire a Top Mortgage Workplace in both 2025 and 2026.
Get Started
Ready to find the right loan for you?
In about 30 seconds you can review financing options available for your investment property. No commitment required.
Informational only. Not a Loan Estimate, approval, or commitment to lend. Program availability and eligibility are subject to lender guidelines, credit approval, property review, and underwriting.
References
1. Zillow Home Values, St. Charles
4. RentCafe, St. Charles rent trends
6. Economic Development Council of St. Charles County
8. Apartment List’s median of $1,337
9. RentHop listing-based average of about $1,950
11. $1,355
12. RentCafe
13. Zillow — Home Values Saint Charles County MO
15. 2025
16. 2026
This article is part of Lendmire’s investment property cash-out refinance program — full qualification details, guidelines, and scenarios live on the program page.
Related reading: Luxury Rental DSCR Loans In New Jersey · Jersey Shore Vacation Rental Loans: DSCR Financing In Ocean City, Cape May And Long Beach Island · DSCR Cash-out Refinance In New Jersey: Pulling Equity From A Rental
Guides: Investment Property Cash-Out Refinance in Missouri
Brandon Miller
Founder & CEO, Mortgage Loan Originator, Lendmire LLC
- Mortgage Loan Originator · NMLS# 1129696 · Verify on NMLS Consumer Access
- North Carolina Real Estate Broker · License# 343312 · Verify on NCREC
- North Carolina Insurance Producer · License# 19053198 · Property, Casualty, Life, Health · Verify on NAIC SBS
- Lendmire LLC · Firm NMLS# 2371349 · Verify firm licensure
Disclosures. The information presented in this article is general market commentary, not financial, legal, or tax advice. Lendmire is a mortgage brokerage (NMLS# 2371349) — not a direct lender or depository institution — and loan placement is subject to lender underwriting. Nothing in this content represents a commitment to lend. Loan terms, pricing, and program availability vary based on borrower qualifications, property characteristics, and state of subject property, and are subject to change at any time. Lendmire complies with Equal Housing Opportunity requirements. Consumer access: nmlsconsumeraccess.org.