
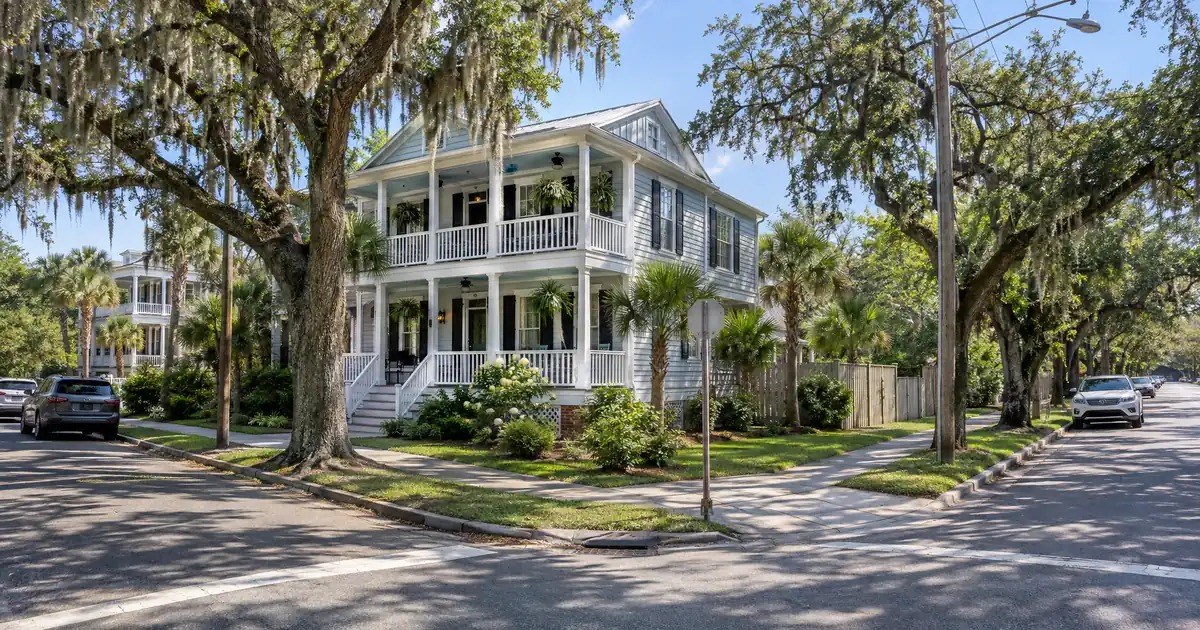
If you own a rental on Folly Beach worth $1 million or more, here’s what most brokers skip: the equity is real, but the rent on that house won’t carry a cash-out loan at normal leverage. You can pull money out. The harder question is what structure survives the coverage test, and what you do with the proceeds afterward.
Zillow puts the average Folly Beach home value at $1,070,951, up 2.9% over the past year. Zumper’s average rent on the island is about $3,000. That gap is the whole article. Real estate investors buying in Folly Beach, South Carolina can work with Lendmire to access DSCR programs across a 41-market footprint that includes D.C. Lendmire is a DSCR-focused mortgage broker that arranges these loans through wholesale lending channels, and the lenders decide eligibility.
DSCR Cash-Out Calculator
Run the cash-out numbers in Folly Beach, SC
Rate source: Freddie Mac 30-yr average via FRED® — Federal Reserve Bank of St. Louis · effective Sep 24, 2026
Prefilled with starting assumptions — enter your property’s value, balance, taxes, and insurance for a more accurate picture.
Program parameters update from Lendmire’s centralized guideline source. Taxes and insurance are editable estimates.
As of Sep 24, 2026 · General Freddie Mac market benchmark, not a Lendmire loan offer. Property value, balance, taxes, and insurance are editable estimates. Maximum loan-to-value varies by lender, program, property type, and seasoning. Not a Loan Estimate, approval, or commitment to lend. Program availability and eligibility are subject to lender guidelines, credit approval, property review, and underwriting.
Key Takeaways:
A cash-out refinance on a Folly Beach, South Carolina rental is underwritten primarily on the property’s rental income measured against its full monthly obligation. Island prices sit far above what long-term rents support, so the deal usually turns on leverage and property type, not on the equity itself.
- Average Folly rent is about $3,000 against roughly $1.07M in average value, per Zumper and Zillow.
- Cash-out tops out at 75% LTV, and seasoning runs about 6 months from title recording.
- At the 75% ceiling, an island single-family rental models well under 0.5x coverage.
- Mainland James Island homes carry far lower balances against comparable rents.
- Thin sales volume means one comp can swing your appraisal. Final terms depend on lender guidelines, property type, leverage, and the borrower’s complete credit picture.
Folly Beach Market Snapshot
A quick read on the Folly Beach investor landscape — figures come from the cited sources below. Confirm current property-level numbers before underwriting.
Why Folly Equity Doesn’t Turn Into Cash Flow
Folly Beach is a lifestyle market, not a rental-yield market. Rent runs about 0.28% of value per month on the island, and every downstream number follows from that.
Folly is a barrier island of about 12.5 square miles of land and 6.4 of water, per Wikipedia’s city entry. The Census Reporter profile counts 1,267 residents, though the 2020 Census count was 2,078. No major employer sits on the island. The workforce here is service, tourism, and a large self-employed share. Point2Homes counts 696 working residents, 29.3% of them self-employed.
Charleston Magazine once called Folly the working man’s beach for a century. Values have long since left that description behind. Rents haven’t followed.
For long-term rental coverage, that produces a structural squeeze. The equity exists on paper, and lenders will look at it. The rent has to support the debt on its own, though, and on the island it usually doesn’t at standard leverage.
The Coverage Math, Step by Step
Coverage is monthly rent divided by the full monthly obligation: principal, interest, taxes, insurance, and any HOA dues. Run one property through it in stages.
Step one: pick the inputs. Take the Zillow average value of about $1.07M and the Zumper average rent of about $3,000. These are modeled assumptions for illustration, not a quote on any specific property.
Step two: apply the ceiling. The cash-out cap is 75% LTV. That is the most any program in the network allows, and many files land lower. These specifics are subject to lender guidelines and a full review of property, leverage, and credit.
Step three: load the full obligation. Model a 30-year amortization with South Carolina-average taxes and insurance. Coverage on the island single-family case lands under 0.5x, including taxes and insurance.
Step four: back into the leverage that works. Keep the same rent and value and lower the loan. Coverage approaches 1.00x only when LTV falls to roughly 30%. At that point the cash-out is small relative to the property’s equity.
A sub-1.00 result doesn’t end the conversation. Some lenders review sub-1.00 scenarios with reduced leverage, stronger credit, and larger reserves. An interest-only structure changes the monthly obligation, and a signed lease or a supported market-rent schedule can change the rent side. None of it is automatic. Each path is reviewed against lender guidelines, credit, reserves, and the property itself.
Attached product shifts the picture only slightly. A local brokerage puts the median Folly townhome near $680K, with HOA dues in the $200–$450 range. Those are agent-blog figures, not MLS data. The balance runs roughly a third below a typical island house, but HOA counts against coverage. At the 75% ceiling and average island rent, a townhome models around 0.65x. Better than a house. Still not a pass.
DSCR files in markets like this one typically look the same on the front end. The owner has substantial paper equity, the rent number is thin or contested, and the appraiser has few comparable sales to work with. The files that move forward tend to be the ones where the borrower chose leverage to match the rent instead of chasing the maximum proceeds. Reserves matter more than usual on high-balance files, and the standard is about six months of PITIA, with more required as balances climb.
If you want the mechanics of the ratio itself, the guide “What Is a DSCR Loan” covers it. For the general comparison against a conventional loan, see the side-by-side comparison.
Six Months, 75%, and What Each One Does
The seasoning clock starts at title recording, not closing paperwork. Plan on about six months of ownership before a cash-out, and note that not every lender treats the clock the same way.
The 75% cap works as a ceiling on proceeds. It isn’t a target, and it isn’t a promise. Proceeds depend on the appraised value, the rent used for lender review, the full obligation, and required reserves. The credit floor for these programs is 620, with pricing tiers stepping up at 660, 680, and 700. Loan amounts go up to $3,000,000 on standard programs, and smaller balances route through select lenders in the network.
Here’s how the clock and the cap interact on Folly. A buyer who bought recently paid current-market prices. Zillow’s 2.9% one-year gain leaves little added equity to extract after six months. The seasoning rule is satisfied, but the value hasn’t moved enough to matter. Cash-out on a fresh purchase mostly makes sense if the buyer got a discount, added value, or is refinancing out of a short-term structure.
Sales volume adds a second wrinkle. The Post and Courier reported that 10 Folly homes sold in a recent July at a median of $1.255 million, about 89% of asking. Sales had just spiked 400% from a very low base. Redfin’s thin-sample data shows a $1.6M median sale price and 172 days on market. Long marketing times often signal a valuation haircut, and an appraiser working from ten sales in a month has very little to anchor on.
Order the appraisal early. Then expect conservative comps.
Where the Equity Actually Came From
Folly is an appreciation market, and the cash-out thesis rests on that. The equity most owners are sitting on was built in one stretch, not by steady annual gains.
A local brokerage’s figures, approximate and agent-sourced, show single-family medians moving from roughly $600–700K in the early part of the run to $1.05–1.2M today. Owners who bought before that climb hold most of the extractable equity. Owners who bought near the top hold much less, and the recent Zillow figure shows why they shouldn’t assume more is coming.
Two consequences follow. A long-time owner can often reach a cash-out that clears a workable LTV with cushion to spare. A recent buyer often can’t. And because the thesis depends on price holding rather than rent growing, this is a market where you refinance from strength, not from hope.
The rent picture won’t rescue the math either. Sources contradict each other badly on Folly rents: Niche shows a median of $1,844, while Zumper’s average is about $3,000, and its year-over-year trend lines contradict each other too. Treat Folly rent growth as volatile and thinly sampled. Nobody publishes a clean vacancy figure for the island, and none of the sources surveyed for this article had cap rates.
The Mainland Play: James Island and West Ashley
The stronger DSCR structure for many Folly-area investors is holding the rentals on the mainland side and treating Folly as the equity you’re pulling from. James Island is the road access to Folly, and it prices like a different planet.
Niche reports a James Island median home value of $416,300 and median rent of $2,009. Other sources put home values higher, so treat that value as a floor and one data point. Run the modeled math at the 75% ceiling with full taxes and insurance, and coverage lands around 0.8x. Drop leverage toward 50% and it moves into the mid-1.1s. That is far closer to workable than anything on the island, and it shows how much the price level, not the rent, drives the difference.
Supply is arriving on James Island too. The Post and Courier reported that a contractor delivered 30 for-rent single-family homes there, and that a 192-townhome build-to-rent community is planned in the Cainhoy area. That’s competition for older rentals, so tenant demand should be verified against comparable new product.
West Ashley and the downtown peninsula matter as demand clusters. Apartments.com notes West Ashley, Downtown Charleston, and North Daniel Island have the most apartments available. Zumper puts the Charleston median rent at $2,599, with 3-bedrooms at $3,072 and houses at $3,138. Those Charleston houses rent for about what the average Folly listing does, at a fraction of the purchase price. I’d rather see a cash-out from a Folly asset recycled into a mainland rental than left sitting as a coverage problem on the island.
Skip multi-unit on Folly itself as a plan. There’s no sourced duplex, triplex, or fourplex rent data for the island, so income stacking there is a hypothesis to check locally, not a strategy. Regionally, a Charleston triplex sold for $1.2 million per the Post and Courier, which shows how expensive small multifamily gets even off the island.
Folly’s Three Zones, Briefly
No reliable neighborhood-level price or rent data exists for the island, so this stays qualitative.
Center Street. The walkable core, with nearly two dozen restaurants and bars. Tenant demand comes from service workers and seasonal users. Every Folly property comes with the same coverage caveat, but this is where the most ordinary rental demand lives.
East end and Lighthouse Inlet. Quieter and residential, with the clearest viewing point of the 161-foot Morris Island Lighthouse, completed in 1876. It draws scenic and luxury-leaning demand. Great for owners, weak for rent-to-value.
DSCR vs. conventional financing
Two common ways to finance an investment property in Folly Beach, SC. They qualify you differently — here’s how investors weigh them.
Why investors choose it
- Qualifies on the property’s rental income — no personal tax returns, W-2s, or pay stubs needed to document income.
- No personal debt-to-income ceiling to clear, so existing mortgages and obligations don’t cap your borrowing the same way.
- Can be closed in an LLC, keeping the property inside a business entity.
- Built for scaling — not held to the limit on number of financed properties that conventional financing applies.
- Underwriting centers on the deal: generally qualifies when the rent covers the payment, a 1.00x coverage ratio being a common baseline (confirmed in underwriting).
- Designed specifically for investment property, including long-term and, where the program allows, short-term rentals.
Where it’s strong
- Often the lowest ongoing financing cost for a buyer who fully qualifies on personal income — a fit for a first property or a cost-first purchase.
Trade-offs for investors
- Requires full personal income documentation and must fit within a debt-to-income limit — salary, existing debts, and other mortgages all count.
- Typically held in your personal name rather than a business entity.
- Caps how many financed properties you can carry, which can become a ceiling as a portfolio grows.
- Evaluates you as a borrower as much as the property, which usually means more paperwork.
How investors usually choose: a first or single property often optimizes for the lowest financing cost; portfolio builders often optimize for leverage, vesting in an LLC, and scaling past conventional caps. The right answer depends on your goals, the property, and current guidelines — both paths run through select lenders in Lendmire’s wholesale network, with eligibility and terms confirmed in underwriting.
The Washout and the west end. The surf-break area. Demand is surfers and beach users, and the pricing is unsupported by any source I found.
The event calendar is real (Sea and Sand Festival, Folly Gras, the Flip Flop Drop), but festivals don’t change a lender’s rent number.
Who Rents Here
Long-term tenant demand for Folly comes from the Charleston metro job base, about nine miles away, not from the island. Census Reporter puts the mean travel time to work at 26.9 minutes.
The Charleston Regional Development Alliance reports Joint Base Charleston supports nearly 25,000 military and civilian jobs, MUSC has about 17,000 employees, and Boeing South Carolina has more than 9,000. Volvo Cars and Mercedes-Benz Vans are also named as major regional employers. Those payrolls are why workforce rentals on the mainland lease. Folly is a commute from them, not a neighbor.
Student demand points the same direction. US News reports College of Charleston enrolled 11,726 students, with 67% living off campus. That is a rental signal for the peninsula, West Ashley, and James Island, not Folly.
Frequently Asked Questions
Can Lendmire help structure a DSCR cash-out refinance scenario for a Folly Beach rental property? Yes, subject to lender guidelines. Lendmire (NMLS# 2371349) is a mortgage broker arranging DSCR investor loans, and cash-out scenarios are capped at 75% LTV. The team can model coverage before you commit to an appraisal. You can get a rental-income loan quote or call 828-256-2183.
How do you qualify for a DSCR cash-out refinance on a Folly Beach rental?
Qualification centers on the property’s rent against its full obligation, with a 1.00 minimum in the standard program, a 620 credit floor, and about six months of reserves. Sub-1.00 files may be reviewed by select lenders, usually with lower leverage. On Folly, expect to lower the loan amount well below the ceiling to get coverage near 1.00x. Lendmire’s South Carolina DSCR loan programs outline the state-level details.
What are the requirements for an investment property loan refinance in Folly Beach, South Carolina? Typical requirements include about six months of ownership from title recording, a qualifying lease or market-rent estimate, a full appraisal, and reserves. Folly is thinly sampled, so lenders may lean on their own rent estimates. Documenting a signed lease and adjacent-market comps from James Island or West Ashley early helps. The refinance pathway for investor properties walks through the file.
Does the equity in a long-held Folly Beach property help a cash-out?
It helps because the LTV starts lower, but proceeds still depend on appraised value and coverage. Owners who bought before the run-up hold the most extractable equity. Recent buyers often hold little more than the seasoning requirement.
Where does the cash go after a Folly cash-out?
Many investors redeploy it into mainland rentals where rent-to-value is stronger. The equity recycle pathway explains how that works. Verify current local rules, taxes, and insurance with qualified local professionals before committing proceeds.
The Blind Spot Nobody Prices In
The biggest blind spot for a DSCR-financed investor here is valuation depth. Ten sales in a good month, long days on market, and conflicting medians between $1.07M and $1.6M mean a single unusual closing can move your appraised value in either direction. Investors sizing a cash-out off the highest number they’ve seen are the ones who get surprised. Size it off the conservative one.
For current guidelines and terms, see Lendmire’s DSCR loan programs page.
About Lendmire
A DSCR-focused mortgage broker, Lendmire (NMLS# 2371349) places investor financing across 41 markets — 40 states plus Washington, D.C. — with DSCR eligibility generally reviewed by the lender on property cash flow instead of tax returns, subject to lender guidelines. Scotsman Guide named Lendmire a Top Mortgage Workplace in 2025 and 2026.
Get Started
Ready to find the right loan for you?
See your offer in seconds. No credit pull, no obligation.
Informational only. Not a Loan Estimate, approval, or commitment to lend. Program availability and eligibility are subject to lender guidelines, credit approval, property review, and underwriting.
References
1. Zillow Home Values: Folly Beach
2. Zumper: Folly Beach Rent Research
3. $1.6M median sale price and 172 days on market
4. Niche — Folly Beach Charleston SC Real Estate
6. Point2Homes — Folly Beach Demographics
7. charlestonmag.com — Folly Beach Summer Guide 2018
8. locatingchs.com — Townhomes for Sale in Folly Beach SC 2026 Your Guide
9. Post and Courier: Folly Beach Home Sales
10. $600–700K in the early part of the run to $1.05–1.2M today
11. Niche: James Island Real Estate
12. postandcourier.com — James Island Rent Charleston County Home Price
13. Charleston median rent at $2,599, with 3-bedrooms at $3,072 and houses at $3,138
14. follybeach.com — Lighthouse
15. Census Reporter — Folly Beach SC
16. Charleston Regional Development Alliance: Major Employers
17. a 2026 Scotsman Guide Top Mortgage Workplace
18. Scotsman Guide 2025 Top Mortgage Workplace
This article is part of Lendmire’s investment property cash-out refinance program — full qualification details, guidelines, and scenarios live on the program page.
Related reading: DSCR Cash Out Refinance Folly Beach South Carolina · DSCR Cash Out Refinance Edisto Beach South Carolina · DSCR Loans Myrtle Beach: Investor Financing for North Myrtle Beach, Surfside, Pawleys Island, Conway & Real Estate Investors
Guides: Investment Property Cash-Out Refinance in Folly Beach, SC · Investment Property Cash-Out Refinance in South Carolina
Brandon Miller
Founder & CEO, Mortgage Loan Originator, Lendmire LLC
- Mortgage Loan Originator · NMLS# 1129696 · Verify on NMLS Consumer Access
- North Carolina Real Estate Broker · License# 343312 · Verify on NCREC
- North Carolina Insurance Producer · License# 19053198 · Property, Casualty, Life, Health · Verify on NAIC SBS
- Lendmire LLC · Firm NMLS# 2371349 · Verify firm licensure
Compliance and disclosures. Lendmire (NMLS# 2371349) is a licensed mortgage broker and is not a direct lender, depository institution, financial advisor, or tax professional. Content in this article is general market analysis and educational information — not financial, legal, or tax advice for any specific situation. Lendmire does not guarantee loan approval; every transaction is subject to underwriting by the funding lender. Mortgage pricing and loan program guidelines are subject to change at any time without notice and vary by borrower characteristics, property type, and state regulations. Lendmire complies with Equal Housing Opportunity. Licensure verification: NMLS Consumer Access.