
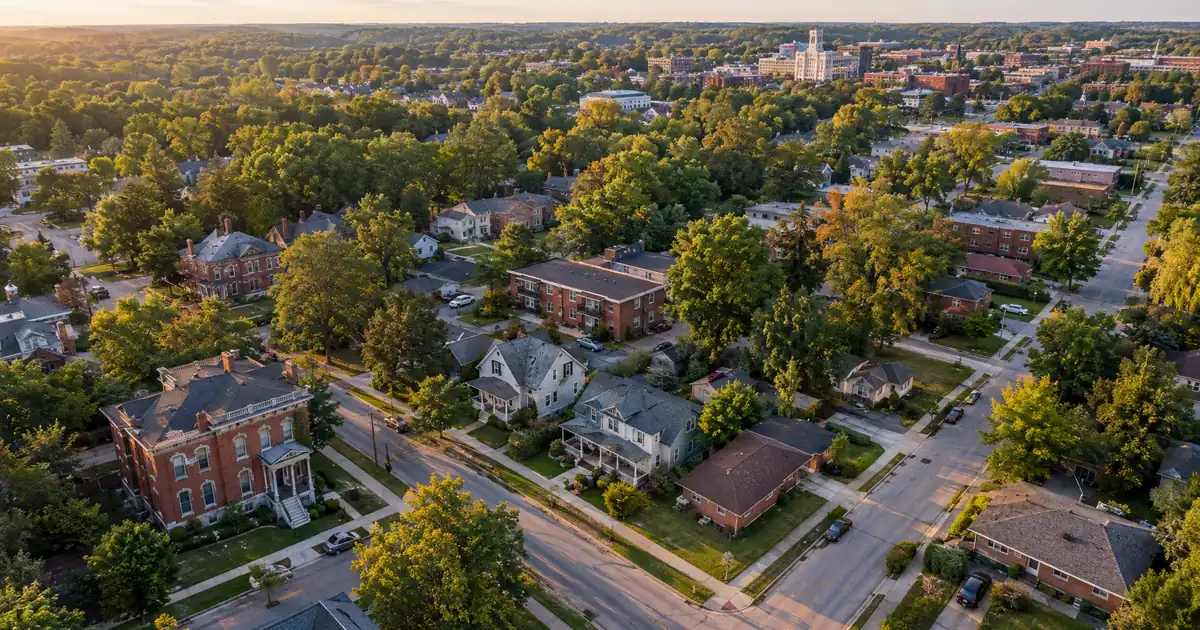
Does a cash-out refinance on a Columbus, Indiana rental actually pencil, or is the price level too modest to leave anything worth pulling? It can pencil, but only if the rent covers the full monthly obligation on the new, larger balance. Redfin’s median sale price ran $276K over a recent three-month window, up just 0.9 percent year over year. Slow appreciation means equity extraction here is a coverage exercise more than an appreciation play.
TL;DR: A cash-out refinance on a Columbus, Indiana rental is underwritten primarily on the property’s rental income measured against its full monthly obligation on the new balance. The investor’s path runs from confirming seasoning and appraised value, to building a defensible rent schedule, to lender review of entity documents, title, and reserves.
DSCR Cash-Out Calculator
Run the cash-out numbers in Columbus, IN
Rate source: Freddie Mac 30-yr average via FRED® — Federal Reserve Bank of St. Louis · effective Sep 24, 2026
Prefilled with starting assumptions — enter your property’s value, balance, taxes, and insurance for a more accurate picture.
Program parameters update from Lendmire’s centralized guideline source. Taxes and insurance are editable estimates.
As of Sep 24, 2026 · General Freddie Mac market benchmark, not a Lendmire loan offer. Property value, balance, taxes, and insurance are editable estimates. Maximum loan-to-value varies by lender, program, property type, and seasoning. Not a Loan Estimate, approval, or commitment to lend. Program availability and eligibility are subject to lender guidelines, credit approval, property review, and underwriting.
- Zillow puts average rent at $1,495 across property types, in a market it labels cool.
- Cash-out is capped at 75 percent LTV, with about six months of seasoning from title recording.
- Three-bedroom HUD fair market rent near $1,539 is a sensible conservative coverage input.
- About 38 percent of the local workforce is in manufacturing, which anchors tenant demand.
- Single-family is 68 percent of housing units; duplex-to-fourplex inventory is scarce.
Columbus, Indiana investors can have DSCR scenarios reviewed through lender programs that Lendmire helps place across 41 markets, including Washington, D.C. Lendmire (NMLS# 2371349) is a DSCR-focused mortgage broker, not a lender, so every scenario below is a structure for lender review, not a promise of approval. Terms depend on lender guidelines, credit, property review, and reserves.
Columbus Market Snapshot
A quick read on the Columbus investor landscape — figures come from the cited sources below. Confirm current property-level numbers before underwriting.
| Metric | Detail |
|---|---|
| Home prices | $232,800 median value (Data USA) |
| University enrollment | Iupuc 1,400+ students (AirPark Columbus College Campus) |
| Population | 1.8m commute-region population (Greater Columbus Indiana) |
| Employment | 9,000+ jobs (Greater Columbus Indiana) |
| Vacancy | 5.8% (StayRentals) |
Why Equity Extraction Is a Coverage Problem Here
Columbus does not hand investors a big appreciation windfall to harvest. Cash-out proceeds are a function of appraised value, the 75 percent ceiling, and what the rent can carry after the new loan closes. The rent-coverage side of the file usually decides how much equity the investor can actually take out.
The published price figures disagree, so here is the frame. Redfin’s $276K three-month median is the canonical number used throughout this piece. Redfin’s own city page shows a higher $289,808 median with a 9.2 percent annual gain for a single recent month. NeighborhoodScout lists a median house value of $319,240, while Data USA reports a lower owner-reported median of $232,800. Different methodologies, different samples. The spread itself is the message: an appraiser could land anywhere in that band, and cash-out proceeds move with the appraisal.
Redfin also shows homes averaging 22 days on market versus 15 a year earlier, and Zillow tags the rental market “cool.” Not distressed. Just no longer a seller’s market with automatic bump-ups at appraisal.
Here is how the extraction math works in percentages. Say an investor holds a Columbus rental whose existing loan balance is 50 percent of the current appraised value. A cash-out at the 75 percent cap frees roughly 25 percent of that value before closing costs and reserves. An investor who bought closer to the appraised value, or whose balance has barely amortized, frees far less. The equity available depends on rent used for lender review, the full monthly obligation, reserves, and the 75 percent ceiling, so it is never a guaranteed figure.
The Employer Base Underneath the Rent Roll
Tenant demand in Columbus comes from industry, not from a campus. Greater Columbus Indiana Economic Development reports that 38 percent of the local workforce is in manufacturing versus 9 percent nationally, which puts Bartholomew County in the top 2 percent of the country. Data USA shows manufacturing as the largest resident employment category at 12,301 people, ahead of health care and social assistance at 4,946 and retail trade at 4,262. Employment grew 0.944 percent in the latest year measured, from about 41.3K to 41.7K jobs.
Cummins anchors the picture. Its global headquarters, tech center, and several production sites employ about 8,000 in the region, and Toyota Material Handling, NTN Driveshafts, and Forvia/Faurecia each employ 1,000 or more (exact headcounts weren’t published). The same development agency counts more than 35 international companies employing 9,000-plus people locally, including two dozen Japanese firms with 5,000-plus jobs. A Ninth Avenue Foods dairy-beverage plant, announced at $103M, adds to the industrial pipeline, though the announcement timing is approximate.
Columbus Regional Health supplies the second leg: more than 2,400 employees and 225 physicians on staff around a 225-bed hospital. Education is small and technical. The AirPark campus cites more than 1,400 IUPUC students, and Ivy Tech’s Columbus location runs 44 programs across seven class sites. This is not a college-town rental market, and student housing is the wrong pitch.
One more angle, and it is an inference, not a tenant survey. Columbus has an unusually high concentration of industrial and mechanical engineers, per BLS data cited in the Indy Partnership announcement. Add the international employers and you get a tenant pool of engineers and relocating professionals on multi-year assignments. Those tenants tend to sign longer leases, which is exactly what a lender wants to see on a rent schedule.
Which Rent Number Does the Appraiser Use?
Sources disagree on Columbus rents, and the gap is widest on three-bedrooms. Underwriting the wrong number is the most common way a cash-out scenario falls apart on paper.
Zillow reports an average of $1,495 across all property types, with a range of $725 to $3,850 and a $45 increase over the prior year. Rentometer shows all-property-type figures of $1,359 for two-bedrooms, $1,883 for three-bedrooms, and $2,437 for four-plus bedrooms. RentCafe puts three-bedroom apartments at $1,535, but that covers only buildings with 50 or more units, so it is a corporate-complex benchmark and not a single-family one. HUD fair market rent for Bartholomew County, as republished by Affordable Housing Hub, is $1,196 for a two-bedroom, $1,539 for a three-bedroom, and $1,669 for a four-bedroom.
The working read: a lender’s appraisal rent schedule for a three-bedroom will likely land between the HUD and apartment figure (about $1,540) and the listing-based figure (about $1,800 to $1,880). Model coverage at the low end. Treat the high end as upside.
Vacancy data is just as scattered. Affordable Housing Online shows 3 percent for the city and 4 percent for the county, while StayRentals, citing Census ACS, shows 5.8 percent. None of these sources names a submarket. Underwrite a 5 to 6 percent allowance and skip the 3 percent headline. Newer apartments, including The Cole downtown, also compete with older single-family rentals for the same tenants.
Coverage Math on a Median-Priced Three-Bedroom
At a median-priced value, a 75 percent cash-out lands in borderline territory, and lower leverage clears comfortably. The inputs below are modeled assumptions, not sourced market facts.
Assume a value of $276K, a 30-year amortization, and full taxes and insurance built into the monthly obligation. Coverage here means rent divided by that full obligation, not principal and interest alone.
| Scenario (modeled) | Rent input | Approx. coverage |
|---|---|---|
| 75 percent LTV, HUD-level rent | $1,540 | Low 0.9x |
| 75 percent LTV, listing-level rent | $1,800 | About 1.1x |
| 65 percent LTV, HUD-level rent | $1,540 | About 1.05x |
| 65 percent LTV, listing-level rent | $1,800 | About 1.2x |
The coverage bands are rounded down. The takeaway: at the 75 percent cap with conservative rent, the number sits under 1.00. Most standard DSCR programs are built around a 1.00x benchmark because rent covers the payment at that level, and some lenders review lower-ratio files with compensating factors, less leverage, different pricing, or more reserves. Those are options a lender would review, not outcomes anyone can promise. The practical paths are a lower loan-to-value request, a sub-1.00 program, or an interest-only structure, each subject to lender guidelines, credit approval, and property review.
Honestly, the lower-leverage option is often the better call. Pulling 65 percent instead of 75 percent gives up some proceeds but buys real coverage cushion. That matters in a cool rental market.
Now the lower-priced end. Using Central Columbus’ small-sample $177K median and the same $1,540 rent at 75 percent LTV, coverage runs roughly 1.4x. That is a much healthier ratio. The trade-off is that proceeds scale with value, so cheaper houses produce comfortable coverage and smaller checks.
DSCR files in markets like this one typically look like a modest-balance loan on a well-leased single-family rental, with coverage that’s tight at maximum leverage and comfortable a step below it. The cleanest files from a documentation standpoint arrive with complete leases, entity documents, title, and property details ready for program review. The ones that stall usually have a rent schedule built from the highest listing comp, not one an appraiser will support. Getting a realistic rent number in first, before the request goes out, saves a re-trade later.
Where the Numbers Pencil (and Where They Don’t)
The older core and east side offer the best rent-to-value. Higher-priced submarkets sacrifice coverage for equity. No reliable neighborhood-level rent source turned up in the research, and Redfin’s neighborhood figures come from very small samples, so treat this as directional.
| Submarket | Price indicator | Investor read |
|---|---|---|
| Central Columbus | $177K median (small sample) | Strongest rent-to-value; smaller proceeds |
| East Columbus | ~$179,900 (listing indicator) | Workforce tenant fit; confirm comps |
| U.S. 31–Indianapolis Road | ~$277,250 (indicator) | Mid-priced; borderline at 75 percent LTV |
| 47201 (west/central) | $312K median, up 20.9 percent | Big jump, possibly mix shift |
| Western Hills | ~$432,450 (indicator) | Likely owner-occupant; weak coverage |
The price indicators come from Redfin’s city page and the Central Columbus and 47201 market pages. Redfin doesn’t label whether the indicators are listing or median prices, so read them as approximate.
The 47201 number deserves skepticism. A 20.9 percent annual jump in a small sample can reflect which houses happened to sell, not a broad repricing. An owner in that zip who already holds the asset may see a higher appraisal, and that’s real, but planning around it is a bet.
Downtown is a different story. It has the design-district walkability, the Cummins headquarters nearby, and new apartments as competing supply. The published downtown price data is too thin to lean on, so any downtown property should be underwritten on its own comps. East 25th Street ($304,000) and Western Rocky Ford ($339,900) sit in the middle-to-upper price band, where coverage gets tighter and the leverage cap bites harder.
Small Multifamily: Scarce Supply, Real Demand
Single-family detached homes are 68.22 percent of Columbus’ housing units, and multi-unit stock is thin. Redfin showed only two multifamily listings for sale in a recent month. Duplexes, triplexes, and fourplexes are scarce, and an owner who already holds one has an asset competitors can’t easily replicate.
No sourced duplex, triplex, or fourplex rents turned up, so any multi-unit coverage figure here would be a hypothetical, and none is offered. Multi-unit properties generally stack several rents against one loan, which tends to help coverage. The catch is that the appraisal and rent schedule need unit-level support.
Renter demand looks steadier than the “cool” label implies. RentCafe reports 8,515 renter-occupied households against 13,211 owner-occupied, or 39 percent renters. StayRentals, using Census ACS, shows median rent near 24.9 percent of household income (the source is undated, so treat it directionally). Rent is a modest share of income for a typical household, so tenants have some room to absorb increases, and that helps retention.
One anecdote worth weighing, with its limits. Gladstone Apartments, a 60-unit development priced below 60 percent of area median income, opened in August and was fully leased by October, ahead of the developer’s projection of 12 units per month. The developer’s own site credits manufacturing job growth. It is one developer-reported data point, but it suggests unmet demand for sub-$1,500 workforce housing, the band where two- and three-bedroom single-family rentals compete.
Seasoning, Leverage Caps, and the Paper Trail
Cash-out eligibility rests on a short list of gating items, and most Columbus owners will hit the leverage cap or the coverage floor before anything else. The typical guideline set looks like this (all subject to lender program terms):
- Maximum LTV: 75 percent on a cash-out. The 80 percent figure applies to purchases, not cash-out.
- Seasoning: about six months of ownership, measured from title recording.
- Minimum coverage: a 1.00 benchmark on rent used for eligibility review versus the full monthly obligation.
- Credit: tiers at 620, 660, 680, and 700, with 620 as the floor.
- Reserves: about six months of PITIA, rising to about nine months above $1,500,000.
- Loan size: up to $3,000,000 on standard programs, with smaller balances routed through select lenders in the network.
That last point matters in Columbus. With median values in the mid-$200Ks, many refinances will be modest balances, and the smaller-loan channel is where those files tend to go. Manufactured homes, log homes, and barndominiums fall outside these DSCR programs, which is worth knowing in a county with rural housing stock.
Entity ownership works, subject to lender program eligibility, and lenders will want operating agreements and entity documents alongside the lease. For the mechanics behind the ratio, see the DSCR qualification mechanics. For how this compares with a bank refinance, see Lendmire’s DSCR-versus-conventional breakdown. Owners weighing structure options can also review refinance options for their investment properties and the cash-out refinance walkthrough, and investors can compare DSCR options across the state. Reach out at 828-256-2183 to walk through a specific file. As always, verify current local rental rules, taxes, and insurance with qualified local professionals.
Redeploying Proceeds When Inventory Is Tight
Pulling equity only helps if there’s something to buy. The multi-unit shortage, 22-day average time on market, and a cool but stable rental base mean the next acquisition is usually another workforce single-family house in the core or east zips, or a small multifamily when one surfaces. The 65 percent versus 75 percent choice above feeds directly into this. Smaller proceeds with cleaner coverage on the existing property may be worth more than maximum proceeds that leave a thin buffer. Then again, an investor with a specific under-market target in hand might reasonably take the maximum. It’s a genuine judgment call.
DSCR vs. conventional financing
Two common ways to finance an investment property in Columbus, IN. They qualify you differently — here’s how investors weigh them.
Why investors choose it
- Qualifies on the property’s rental income — no personal tax returns, W-2s, or pay stubs needed to document income.
- No personal debt-to-income ceiling to clear, so existing mortgages and obligations don’t cap your borrowing the same way.
- Can be closed in an LLC, keeping the property inside a business entity.
- Built for scaling — not held to the limit on number of financed properties that conventional financing applies.
- Underwriting centers on the deal: generally qualifies when the rent covers the payment, a 1.00x coverage ratio being a common baseline (confirmed in underwriting).
- Designed specifically for investment property, including long-term and, where the program allows, short-term rentals.
Where it’s strong
- Often the lowest ongoing financing cost for a buyer who fully qualifies on personal income — a fit for a first property or a cost-first purchase.
Trade-offs for investors
- Requires full personal income documentation and must fit within a debt-to-income limit — salary, existing debts, and other mortgages all count.
- Typically held in your personal name rather than a business entity.
- Caps how many financed properties you can carry, which can become a ceiling as a portfolio grows.
- Evaluates you as a borrower as much as the property, which usually means more paperwork.
How investors usually choose: a first or single property often optimizes for the lowest financing cost; portfolio builders often optimize for leverage, vesting in an LLC, and scaling past conventional caps. The right answer depends on your goals, the property, and current guidelines — both paths run through select lenders in Lendmire’s wholesale network, with eligibility and terms confirmed in underwriting.
Frequently Asked Questions
Does Columbus’ price level make a DSCR cash-out worthwhile?
It depends on how much value the investor holds relative to the existing balance. With a median around $276K, proceeds are modest but coverage is workable, especially in the lower-priced core and east zips. Investors with meaningful equity and a well-leased house are the natural fit.
Which rent should I use for a three-bedroom Columbus rental?
Start with the conservative end, near HUD’s $1,539 fair market rent for a three-bedroom, and treat listing-based figures near $1,800 to $1,880 as upside. An appraiser’s rent schedule will likely land in between. Modeling at the low end keeps the file from breaking if the schedule comes in lighter than expected.
Is Columbus a college-town rental market?
No. IUPUC’s 1,400-plus students and Ivy Tech’s local programs are a small commuter and technical base. Demand here comes from Cummins, the supplier plants, and Columbus Regional Health. Student housing is the wrong strategy.
Can a duplex or fourplex improve cash-out coverage in Columbus?
It can in principle, since several rents stack against one loan, but inventory is scarce and no sourced multi-unit rents were found. Any multi-unit scenario needs unit-level leases and an appraisal rent schedule before the numbers mean anything.
How long must I own the property before a cash-out?
Typical program guidance is about six months of ownership, measured from title recording. Loan-to-value is capped at 75 percent, and the actual proceeds depend on appraised value, coverage, and reserves.
The Next Step Before Any Application
Before an owner picks a leverage level, the most useful diligence step is to pull three recent closed sales and three current lease comps for the exact property type and zip, then run the coverage on the conservative rent. Columbus’ price and rent data conflict enough across sources that a local comp set beats any citywide average. The City of Columbus also publishes a housing study that may hold the best local supply and demand data, and it’s worth reading before committing to a redeployment plan.
For current guidelines and terms, see Lendmire’s DSCR loan programs page.
About Lendmire
Lendmire (NMLS# 2371349) is a mortgage brokerage built around DSCR investor lending, with programs available in 41 markets, including Washington, D.C. DSCR lenders commonly evaluate rental-income coverage instead of personal income paperwork, a practical fit for LLC-owned and multi-property investors. Terms vary by lender, property, leverage, and program. Lendmire is a 2026 Scotsman Guide Top Workplace and a top-ranked workplace in 2025, and recent Lendmire news and press releases are published on EIN Presswire.
Get Started
Ready to find the right loan for you?
In about 30 seconds you can review financing options available for your investment property. No commitment required.
Informational only. Not a Loan Estimate, approval, or commitment to lend. Program availability and eligibility are subject to lender guidelines, credit approval, property review, and underwriting.
References
1. Redfin: Columbus, IN housing market
2. Zillow Rental Manager: Columbus, IN
5. Greater Columbus Indiana Economic Development: Workforce and Wages
6. columbusin.org — Advantages Fdi Preferred Destination
7. stayrentals.com — Indiana Columbus
10. Greater Columbus Indiana Economic Development: Employers
11. Columbus Regional Health: About Us
12. Ivy Tech’s Columbus location
14. RentCafe
15. as republished by Affordable Housing Hub
16. Affordable Housing Online — Indiana Bartholomew County
18. Central Columbus
19. 47201
20. realamericallc.com — Affordable Housing IN Columbus
21. a 2026 Scotsman Guide Top Workplace
22. Scotsman Guide — Top Workplaces 2025
This article is part of Lendmire’s investment property cash-out refinance program — full qualification details, guidelines, and scenarios live on the program page.
Related reading: DSCR Cash Out Refinance Columbus Indiana · Cash Out Refinance Investment Property Columbus Georgia · Cash Out Refinance Investment Property in Shelbyville, IN
Guides: Investment Property Cash-Out Refinance in Columbus, IN · Investment Property Cash-Out Refinance in Indiana
Brandon Miller
Founder & CEO, Mortgage Loan Originator, Lendmire LLC
- Mortgage Loan Originator · NMLS# 1129696 · Verify on NMLS Consumer Access
- North Carolina Real Estate Broker · License# 343312 · Verify on NCREC
- North Carolina Insurance Producer · License# 19053198 · Property, Casualty, Life, Health · Verify on NAIC SBS
- Lendmire LLC · Firm NMLS# 2371349 · Verify firm licensure
Compliance and disclosures. Lendmire (NMLS# 2371349) is a licensed mortgage broker and is not a direct lender, depository institution, financial advisor, or tax professional. Content in this article is general market analysis and educational information — not financial, legal, or tax advice for any specific situation. Lendmire does not guarantee loan approval; every transaction is subject to underwriting by the funding lender. Mortgage pricing and loan program guidelines are subject to change at any time without notice and vary by borrower characteristics, property type, and state regulations. Lendmire complies with Equal Housing Opportunity. Licensure verification: NMLS Consumer Access.