
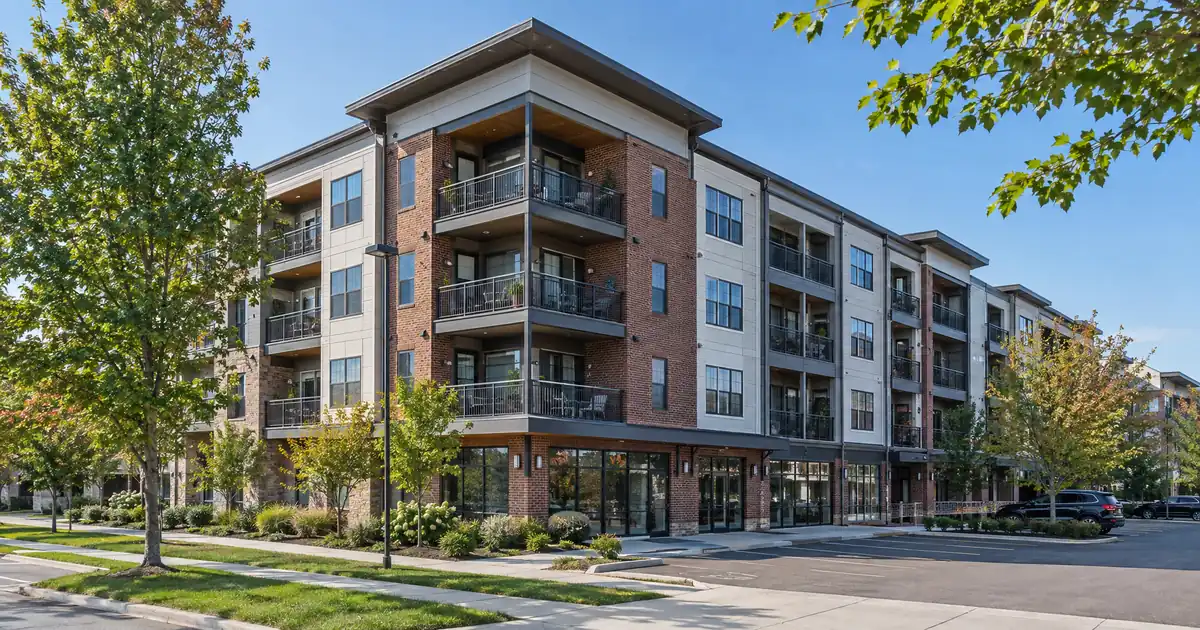
Most Grove City owners who go looking for cash-out proceeds hit the same wall. The property appraises fine, the seasoning clock has run, and then the coverage test comes back thin, because a typical single-family rent doesn’t carry a full monthly obligation at high leverage. That friction, not the paperwork, decides how much equity a Grove City rental can release.
The Quick Read: A cash-out refinance on a Grove City, Ohio rental is underwritten primarily on the property’s rental income measured against its full monthly obligation, so the file runs from ownership seasoning to appraisal to a coverage test, with proceeds capped at 75 percent of appraised value.
DSCR Cash-Out Calculator
Run the cash-out numbers in Grove City, OH
Rate source: Freddie Mac 30-yr average via FRED® — Federal Reserve Bank of St. Louis · effective Sep 24, 2026
Prefilled with starting assumptions — enter your property’s value, balance, taxes, and insurance for a more accurate picture.
Program parameters update from Lendmire’s centralized guideline source. Taxes and insurance are editable estimates.
As of Sep 24, 2026 · General Freddie Mac market benchmark, not a Lendmire loan offer. Property value, balance, taxes, and insurance are editable estimates. Maximum loan-to-value varies by lender, program, property type, and seasoning. Not a Loan Estimate, approval, or commitment to lend. Program availability and eligibility are subject to lender guidelines, credit approval, property review, and underwriting.
- Hospital-corridor demand along North Meadows Drive and Stringtown Road anchors the tenant pool.
- Duplex income stacks per door. Average single-family rent struggles against a full obligation at high leverage.
- Sold-price comps run above index values, which can help appraisals on well-kept stock.
- New supply is clustering near the hospital and Town Center, so underwrite rent growth conservatively there.
Grove City Market Snapshot
A quick read on the Grove City investor landscape — figures come from the cited sources below. Confirm current property-level numbers before underwriting.
| Metric | Detail |
|---|---|
| Home prices | $398K median (Homes.com Grove City) |
| Recent appreciation | +8.8% (Redfin Grove City Housing Market) |
| Employment | 285 jobs (CityScene, OhioHealth and Mount) |
The Hospital Corridor Carries the Refinance Thesis
The North Meadows Drive and Stringtown Road corridor is the strongest tenant-demand pocket in Grove City, and it is where an equity-extraction thesis has the most support. The reason is employment, not amenities. The demand is steady and year-round, though the headcounts behind it come from projections.
Mount Carmel Grove City is a teaching hospital on North Meadows Drive. Gresham Smith, the project’s architect, describes a 214-bed, 500,000-square-foot facility with a medical office building. Sources differ slightly on bed count, so treat that figure as approximate. Earlier CityScene coverage put the campus at $361 million and projected local Mount Carmel employment climbing past 1,600. That was a projection, not a payroll count. The same piece credited the OhioHealth Grove City Methodist Hospital with 285 added jobs, also a projection. A VA outpatient clinic sits on the same road.
That is an unusually concentrated medical build-out for a suburb of roughly 45,000 people. Nurses, technicians, and medical assistants are the obvious renters of two- and three-bedroom homes within a short commute. The employer list is still incomplete: the City’s annual financial report carries a principal-employers table on its finance page, and an investor should pull the current version before leaning on any headcount.
Why does this matter for a cash-out? Lenders review tenant durability and lease stability along with the ratio itself. Hospital-adjacent rentals with a documented lease history are cleaner files than a vacant flip on the edge of a subdivision.
Why Does Average Rent Barely Cover the Loan?
Grove City’s rent-to-price ratio runs near 0.5 percent per month, which is thin for a coverage-based product. That figure is Lendmire Research’s arithmetic on published averages, not a published statistic. It divides Zumper’s average rent of $1,549 by Zillow’s average home value of $325,077.
Rent data here conflicts. Zumper shows rents up 10 percent over the past year, while RentCafe shows $1,520 on average, up 0.64 percent. RentCafe also reports $1,557 for a two-bedroom and $2,194 for a three-bedroom. It covers only buildings with 50 or more units, so it skews toward newer large complexes rather than the small landlord’s house.
Zillow’s $325,077 is the canonical value used here. Redfin’s September data puts the median sale price higher, at $385,000, up 8.8 percent, and Homes.com shows a sold-price median near $398,000 for the same market. Those are different methodologies (sold medians versus an index average), which explains most of the gap.
Now the modeled math. The inputs below are assumptions, not market facts. Coverage is rent divided by full monthly obligation: principal, interest, taxes, and insurance, using Ohio-average tax and insurance loads and a 30-year fixed structure.
| Structure (modeled) | Rent-to-value | Coverage at 75% LTV |
|---|---|---|
| Average single-family | About 0.5 percent | Near 0.7x |
| Duplex, assumed $300K value | About 0.77 percent | Low 1.1x range |
The duplex row uses the combined $2,300 from an example listing (two units at $1,200 and $1,100) against a modeled $300,000 value. The single-family row uses the averages above. Both round down, and both include taxes and insurance.
Read that plainly. At 75 percent leverage, an average single-family rental sits well under the 1.00 benchmark that most standard DSCR programs are built around. Some lenders review lower ratios, but usually with lower leverage, stronger compensating factors, or different pricing. Pulling leverage toward the 50 percent range is what typically brings a single-family file near 1.00. That shrinks proceeds, and the duplex math shows why small multifamily is the better cash-out vehicle here.
Duplexes and Small Multifamily: Thin Inventory, Better Coverage
Per-door income is the only structural advantage Grove City’s rent-to-price ratio offers, and it shows up in small multifamily. The catch is supply. The stock is owner-heavy: RentCafe counts 4,997 renter-occupied households against 12,486 owner-occupied, or 29 percent renters.
Two example listings show the range. A Redfin multi-family listing near the Town Center shows a duplex with two 2-bed, 1.5-bath units leased at $1,200 and $1,100. A Homes.com search shows six multi-family homes for sale, priced from $230,000 to $725,000. One older three-rental listing carried prior rents of $850 and $900 on its two-bedroom units, and its three-bedroom house needed a kitchen renovation before re-leasing. These are single listings, not market statistics. Don’t average them.
Three implications for a refinance:
- Underwrite to lease-in-place rents. In-place duplex rents of $1,100 to $1,200 per door sit below the Zumper and RentCafe averages. Treat the gap as upside, not assumed income.
- Expect shallow comps. Roughly six listings means an appraiser has little to work with, which can limit how much value a cash-out supports.
- Value-add stock is not stabilized stock. A property needing a kitchen before it can lease is a rehab-then-refinance play, and the file should wait until it is leased.
Picture an investor who bought an older duplex near Holt-Alkire, renovated it, and has held title for six months. With both doors leased at documented rents, the file has a real coverage story. The same investor holding a single-family rental at the market average has the seasoning but not the ratio. That difference sorts these files before the appraisal is ordered.
Where Sold Prices Diverge From Index Values
Appraisers work from sold comps, and in Grove City those sit well above index estimates. Homes.com shows a median sale price near $398,000 and an average near $395,419, with a separate figure of $370,000, up 4 percent, and 32 days to sell. Redfin shows 50 days on market against 38 the year before, and a median of $203 per square foot, up 1.8 percent. The sources conflict on speed of sale, and one page shows two different medians without explaining why.
An investor holding a well-kept property might see an appraisal land above the Zillow index number. That is a possibility, not a promise, and it depends on comparable quality. Appreciation is positive but flattening: Zillow shows about 2 percent over the past year while Redfin’s September figure was 8.8 percent. Homes sitting longer suggests less pricing power for sellers, which means less room for an appraiser to stretch.
Before promising a payout to anyone, pull a local MLS comp set. Equity available depends on rent used for lender review, the full monthly obligation, reserves, and the 75 percent LTV ceiling. It is never a guaranteed cash figure.
Seasoning, Leverage, and What Lenders Review
Under the network’s typical guidelines, a DSCR cash-out refinance allows up to 75 percent LTV, with about six months of ownership measured from title recording. Standard programs are built around a 1.00 minimum coverage ratio, credit tiers of 620, 660, 680, and 700 (floor 620), and reserves of about six months of full obligation. Loan amounts run up to $3,000,000 on standard programs, with smaller balances routed through select lenders. These are guideline ranges. Actual eligibility depends on the lender, credit profile, property review, and program terms. Manufactured homes, log homes, and barndominiums fall outside these programs.
The cash-out is a leverage decision as much as a qualification one. Sub-1.00 files may be reviewed under a sub-1.00 program or a lower-leverage structure, but that is a lender call, not an assumption.
In markets like this one, the common friction point on the deal desk is the gap between the rent an owner says a property earns and the rent a lease and appraisal can document. Files with signed leases, a rent schedule, and a fresh insurance quote in hand tend to move through review with fewer resubmissions. Owner-heavy suburbs with thin rental comps make that documentation matter more, not less.
Beulah Park, the Town Center, and the Pockets That Rent for Less
Cheaper pockets carry the coverage math better than premium ones, though the data is mostly listing-based. Zumper’s most affordable grove City neighborhoods are Indian Trails at $1,286 per month, Hennigans Grove at $1,499, and Keller Farms at $1,509. Apartments.com lists Holt-Alkire among the more affordable rental areas and Beulah Park among the most expensive. Those rankings are directional, and the Apartments.com data is older.
Beulah Park is the local-color story: a former thoroughbred racetrack redeveloped into housing and retail near the Town Center. Columbus Underground reports that Beulah Crossing adds two three-story buildings with 40 urban-style apartments above ground-floor retail. That is large-scale, professionally managed product, and a poor comp for a small landlord’s house.
The Historic Town Center, with older stock and walkability, suits low-basis duplex holders. Pinnacle, a large newer subdivision, is mostly a for-sale market. Neighborhood-level prices and rents beyond the figures above aren’t sourced, so the rest stays qualitative.
Skip the New-Build Trap
New construction is the worst fit for a coverage-driven cash-out. Realty Ohio’s marketing page prices new-construction communities from $375,000 to $700,000 and up, while updated single-family runs $300,000 to $430,000 and entry-level homes $220,000 to $300,000. That is a brokerage page, so read the tiers as directional.
Set a $375,000-plus basis against rents near the Zumper average and the ratio falls below the already-thin single-family figure. New builds work on appreciation and owner-occupant demand. City-linked projections, per the Columbus Dispatch via AOL, call for another 15,000 residents by 2050, which supports long-run value. It does not support a 1.00 coverage ratio today.
The stronger play is probably the older duplex over the new single-family for cash-out purposes. Investors chasing appreciation could argue the other way, but a refinance needs the number to clear first.
Supply Is Coming to the Hospital Blocks
New rental supply is clustering exactly where demand is strongest, so rent-growth assumptions near the hospital and Town Center deserve a haircut. WOSU reports that the Columbus Metropolitan Housing Authority opened the 82-unit Cobblestone Manor, an income-restricted senior community, in a city that already has 188 federally subsidized apartments. Dispatch reporting via AOL says CMHA plans more than 200 additional units near Mount Carmel Grove City and more than 100 townhomes near I-270. A 10TV report describes 150 planned market-rate units at the Broadway Live mixed-use project. That project’s status may have changed since the report, so verify it.
Income-restricted units serve a different segment. The market-rate additions are the ones that could compete with small-landlord rentals. The RentCafe growth figure of 0.64 percent, against Zumper’s 10, suggests the market has already split between new large-building rents and everything else.
Local rental rules, taxes, and insurance vary by property, so verify current requirements with qualified local professionals. Beyond that, the refinance case here rests on documented rents, not projected ones.
DSCR vs. conventional financing
Two common ways to finance an investment property in Grove City, OH. They qualify you differently — here’s how investors weigh them.
Why investors choose it
- Qualifies on the property’s rental income — no personal tax returns, W-2s, or pay stubs needed to document income.
- No personal debt-to-income ceiling to clear, so existing mortgages and obligations don’t cap your borrowing the same way.
- Can be closed in an LLC, keeping the property inside a business entity.
- Built for scaling — not held to the limit on number of financed properties that conventional financing applies.
- Underwriting centers on the deal: generally qualifies when the rent covers the payment, a 1.00x coverage ratio being a common baseline (confirmed in underwriting).
- Designed specifically for investment property, including long-term and, where the program allows, short-term rentals.
Where it’s strong
- Often the lowest ongoing financing cost for a buyer who fully qualifies on personal income — a fit for a first property or a cost-first purchase.
Trade-offs for investors
- Requires full personal income documentation and must fit within a debt-to-income limit — salary, existing debts, and other mortgages all count.
- Typically held in your personal name rather than a business entity.
- Caps how many financed properties you can carry, which can become a ceiling as a portfolio grows.
- Evaluates you as a borrower as much as the property, which usually means more paperwork.
How investors usually choose: a first or single property often optimizes for the lowest financing cost; portfolio builders often optimize for leverage, vesting in an LLC, and scaling past conventional caps. The right answer depends on your goals, the property, and current guidelines — both paths run through select lenders in Lendmire’s wholesale network, with eligibility and terms confirmed in underwriting.
Putting Proceeds to Work
A cash-out is only useful if the capital has somewhere to go. In Grove City the most consistent destinations are lower-basis multifamily and value-add stock, since coverage rises as basis falls. An investor who pulls equity from an appreciated single-family rental and redeploys it into a duplex may improve portfolio coverage overall, though the first property’s leverage rises. For cash-out sizing, the calculator does the dollar conversion. To see how the DSCR math pencils on a specific property, request a quote here, or call 828-256-2183.
For current guidelines and terms, see Lendmire’s DSCR loan programs page.
Frequently Asked Questions
How much equity can a Grove City rental actually release?
It depends on rent used for lender review, the full monthly obligation, reserves, and a 75 percent LTV ceiling. In Grove City, the rent-to-value ratio is thin enough that single-family files often need lower leverage than the ceiling to reach 1.00. Duplexes with documented per-door rents generally stretch further.
Does the six-month seasoning clock start at purchase or at recording?
It runs from title recording, at about six months of ownership under the network’s typical guidelines. A Grove City investor who bought a value-add duplex should time the refinance after renovation and lease-up, since a vacant or partially leased unit weakens the coverage story.
Will Grove City appraisals support the higher sold-price medians?
Possibly, but not reliably. Sold medians from Homes.com and Redfin run well above Zillow’s index value, yet inventory is thin and comps for duplexes are shallow. A local MLS comp pull before ordering the appraisal is the practical check.
Do the hospitals make Grove City a safer bet for tenant demand?
They give the corridor a steady employment base, since Mount Carmel Grove City, OhioHealth Grove City Methodist, and the VA clinic all sit near North Meadows Drive and Stringtown Road. The headcount figures come from older projections, though, so treat the anchor as qualitative support, not a payroll number.
Does Grove City beat neighboring Columbus for a cash-out play?
On pure coverage, the math favors Columbus proper’s multifamily, where doors are plentiful and per-door basis is often lower. Grove City wins only when an investor holds a low-basis duplex near the hospital corridor, where the tenant base is steady.
For broader investor-financing rules and property-type coverage across the state, see Ohio DSCR loans.
For the mechanics of pulling equity out of a rental property, see cash-out refinance on an investment property.
About Lendmire
As a DSCR and non-QM mortgage broker, Lendmire (NMLS# 2371349) connects investors with wholesale lending channels across 41 markets, including Washington, D.C. Lender review centers on the property’s rental income rather than the borrower’s traditional personal-income documentation, which suits self-employed operators and portfolios past four financed properties. The firm is recognized by Scotsman Guide as a 2026 Top Workplace and a 2025 Scotsman Guide Top Mortgage Workplace.
Get Started
Ready to find the right loan for you?
In about 30 seconds you can review financing options available for your investment property. No commitment required.
Informational only. Not a Loan Estimate, approval, or commitment to lend. Program availability and eligibility are subject to lender guidelines, credit approval, property review, and underwriting.
References
1. Homes.com
2. Redfin Grove City Housing Market
6. grovecityohio.gov — Finance page
7. Zumper’s
8. Zillow’s
9. RentCafe
10. Redfin multi-family listing
11. Apartments.com
13. AOL
14. WOSU
15. 10TV report
16. recognized by Scotsman Guide as a 2026 Top Workplace
17. a 2025 Scotsman Guide Top Mortgage Workplace
This article is part of Lendmire’s investment property cash-out refinance program — full qualification details, guidelines, and scenarios live on the program page.
Related reading: DSCR Cash Out Refinance Grove City Ohio · DSCR Cash Out Refinance Dublin Ohio · Cash Out Refinance Investment Property Dublin Ohio
Guides: Investment Property Cash-Out Refinance in Ohio
Brandon Miller
Founder & CEO, Mortgage Loan Originator, Lendmire LLC
- Mortgage Loan Originator · NMLS# 1129696 · Verify on NMLS Consumer Access
- North Carolina Real Estate Broker · License# 343312 · Verify on NCREC
- North Carolina Insurance Producer · License# 19053198 · Property, Casualty, Life, Health · Verify on NAIC SBS
- Lendmire LLC · Firm NMLS# 2371349 · Verify firm licensure
Compliance and disclosures. Lendmire (NMLS# 2371349) is a licensed mortgage broker and is not a direct lender, depository institution, financial advisor, or tax professional. Content in this article is general market analysis and educational information — not financial, legal, or tax advice for any specific situation. Lendmire does not guarantee loan approval; every transaction is subject to underwriting by the funding lender. Mortgage pricing and loan program guidelines are subject to change at any time without notice and vary by borrower characteristics, property type, and state regulations. Lendmire complies with Equal Housing Opportunity. Licensure verification: NMLS Consumer Access.