
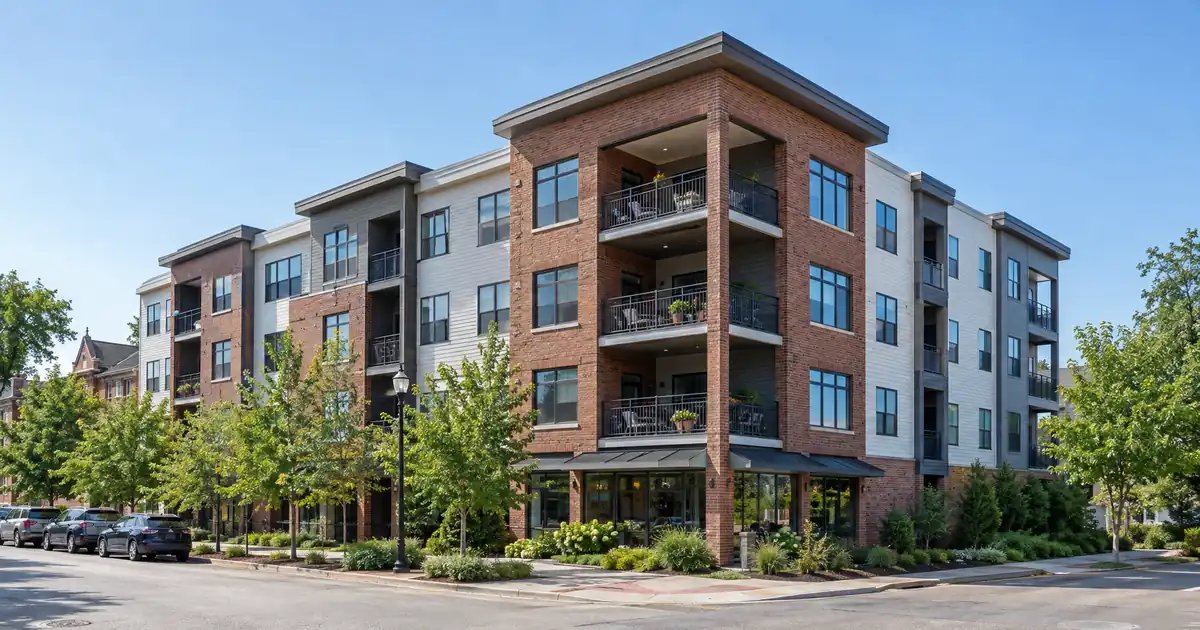
A Kirkwood single-family rental that appraises near the Redfin median of $482K and rents near the Zumper average of $1,995 does not clear 1.00 coverage on a 75% cash-out refinance once taxes and insurance sit in the denominator. Modeled that way, the number lands around 0.7x. That gap decides which Kirkwood owners can pull equity and which should think twice. These specifics are subject to lender guidelines and a full review of property, leverage, and credit.
The Quick Read: A cash-out refinance on a Kirkwood, Missouri rental is underwritten primarily on the property’s rental income measured against its full monthly obligation, after the lender orders an appraisal and confirms ownership seasoning. Equity is the easy part here, and coverage is the hard part.
DSCR Cash-Out Calculator
Run the cash-out numbers in Kirkwood, MO
Rate source: Freddie Mac 30-yr average via FRED® — Federal Reserve Bank of St. Louis · effective Sep 24, 2026
Prefilled with starting assumptions — enter your property’s value, balance, taxes, and insurance for a more accurate picture.
Program parameters update from Lendmire’s centralized guideline source. Taxes and insurance are editable estimates.
As of Sep 24, 2026 · General Freddie Mac market benchmark, not a Lendmire loan offer. Property value, balance, taxes, and insurance are editable estimates. Maximum loan-to-value varies by lender, program, property type, and seasoning. Not a Loan Estimate, approval, or commitment to lend. Program availability and eligibility are subject to lender guidelines, credit approval, property review, and underwriting.
- Redfin shows a $482K median price, up 4.8% year over year. Equity is building.
- Modeled single-family coverage, including taxes and insurance, sits well below 1.00x at 75% LTV.
- Older two-to-four-unit stock has the best shot at clearing the 1.00x baseline.
- Downtown new construction adds rent competition for nearby apartments and small multifamily. Terms vary by lender guidelines, property type, leverage, credit profile, and full file review.
Kirkwood Market Snapshot
A quick read on the Kirkwood investor landscape — figures come from the cited sources below. Confirm current property-level numbers before underwriting.
| Metric | Detail |
|---|---|
| Home prices | $482K median (Redfin Kirkwood Housing Market) |
| Recent appreciation | +4.8% yoy (Redfin Kirkwood Housing Market) |
Where Equity Is Real and Coverage Isn’t
Lendmire (NMLS# 2371349) is a DSCR-focused mortgage broker. Kirkwood, Missouri rental property investors can tap DSCR programs that Lendmire arranges, available across 41 markets, including Washington, D.C. Those programs suit this suburb’s equity. The harder question is whether the rent supports the loan.
Start with the equity side, because it is genuine. Redfin puts median sale price per square foot at $278, up 15.6% from a year earlier, and reports that the average home sells about 3% above list and goes pending in around 8 days. Zillow’s home value index reads $446,811, up 3.4%. The two sources measure different things (median sale versus an index of all homes), so treat the gap between them as methodology, not disagreement. Either way, an owner who bought a few years ago is likely sitting on meaningful appreciation.
Now the income side. The same Redfin median against the Zumper average implies a monthly rent of roughly 0.41% of price. By comparison, RentCafe’s three-bedroom average of $2,155 (buildings with 50+ units only) lifts that to about 0.45%. Those ratios are my arithmetic from sourced figures, not a published statistic. They are still far from the 0.7–1.0% range that makes DSCR math easy.
DSCR divides monthly rent by the full monthly obligation: principal, interest, taxes, insurance, and any HOA dues. Lendmire’s DSCR walkthrough covers the mechanics. Run a modeled $482K single-family home at 75% LTV against $1,995 in rent, including taxes and insurance, and coverage comes out near 0.7x. Assuming $2,155 in rent nudges it up slightly. Neither reaches the 1.00x baseline that most standard programs are built around, subject to lender guidelines.
What a Sub-1.00 Kirkwood File Can Look Like
A sub-1.00 result doesn’t end the conversation, but it changes the questions. Lenders may review a sub-1.00 program, an interest-only structure, or lower leverage than the 75% ceiling. Each usually comes with stronger credit, deeper reserves, different pricing, or more equity left in the property. Qualification stays subject to lender guidelines, credit approval, and property review.
The better question is whether to use those structures at all. If the goal is to buy another Kirkwood-area rental and the file only works by stretching, the stretch compounds. The first property runs negative, and the second inherits the same thin ratio. Sub-1.00 is a defensible choice when the owner has strong outside income, a clear appreciation thesis, and a plan for the proceeds that doesn’t depend on that property’s cash flow. It’s a warning sign when it’s the only way to get the loan done.
This is a genuine toss-up. Kirkwood’s appreciation case is strong enough that some owners will happily carry a thin-coverage property for the equity growth. Others will look at a 0.7x file and decide the capital belongs elsewhere.
Duplexes Change the Math
Two-to-four-unit properties have the best chance of clearing the baseline in this market. DSCR programs generally cover one-to-four-unit residential, and income stacking is what lifts the ratio.
Run the numbers on a modeled duplex valued at $400K, with each side renting at the $1,567 RentCafe two-bedroom average. Those inputs are modeled assumptions, not market data for a specific property. At 75% LTV, including taxes and insurance, coverage lands around 1.2x. That’s the same lender, the same leverage, and a very different file from the single-family case. Exact terms depend on the lender’s guidelines, property type, leverage, and a full review of the borrower’s file.
Two cautions apply. First, small multifamily inventory here is thin. A scan of current Homes.com listings turns up very few small-building examples, and appraisers may struggle to find comps. A thin appraisal can cut the value that the 75% ceiling applies to. Second, the asking rent on a dated duplex may not match the RentCafe average, which reflects larger, newer buildings. Model the actual unit.
Owners who already hold a small multifamily building near downtown are in the strongest position to pull equity here. Owners who hold only single-family homes face the tougher file.
Downtown Supply and the Rent Spread
Downtown Kirkwood is the strongest walkable rental submarket. Its business district is on the National Register of Historic Places and centers on restaurants, shops, and the Farmers’ Market. It is also where new supply is landing.
The Webster-Kirkwood Times reports that Pitman Place would add 60 units: 23 one-bedrooms, 24 two-bedrooms, and 13 three-bedrooms. FirstAlert4 reported council approval of the development with ground-floor retail. It sits a block from The James, a 152-unit building a local blog says was approved on a 5-2 vote. That’s roughly 212 new units in the downtown core. Downtown-adjacent two- and three-bedrooms will compete directly with that product.
Asking rents show how wide the spread runs. On Redfin’s apartment listings, The James asks $3,090 for a two-bedroom, Kirkwood Station Plaza asks $2,550, and Kirkwood Bluffs asks $1,265. These are listing-page asking rents and may include concessions. A two-bedroom near $1,265 won’t support anything like the coverage of one near $3,090. The blended $1,564 RentCafe average hides that spread, so underwrite the specific unit, not the city.
The skeptical read: new Class A product tends to pull tenants from older nearby stock, and the appraiser’s rent comps may not match your lease. An owner refinancing a downtown-adjacent rental should assume the new buildings’ concessions are part of the comparison set.
Meramec Highlands, Central Place, and Jefferson-Argonne
The older residential pockets are less about rent data and more about what isn’t known. Meramec Highlands has Victorian and colonial homes with mature trees and skews high-priced. Central Place and Jefferson-Argonne are historic districts with mid-century and older homes near Kirkwood Park. No reliable neighborhood-level prices or rents turned up for any of them, and no source ranks cash-flow neighborhoods here. Treat any claim of “the best cash-flow pocket” as unsupported.
What can be said: these are owner-heavy areas. About 77% of Kirkwood’s 12,110 households are owner-occupied, and only 23% rent. The rental pool is thin, which helps lease-up on a well-priced unit but limits how many comparable leases an appraiser can find. Older single-family rentals in these areas are the most likely to hit the 0.7x coverage problem, because they carry premium prices without premium rents. The Manchester Road and Kirkwood Road corridors on the city’s edges are confirmed locations, but no rent or price data came with them.
Why Demand Holds Despite the Thin Yield
Kirkwood isn’t a yield market, but demand has a stable profile. Census Bureau QuickFacts shows a population of 29,363, a median age of 41.8, and 67.9% of residents holding a bachelor’s degree or higher. Cubit Planning puts median household income at $121,270. Data USA lists the top resident employment sectors as professional, scientific, and technical services (1,936 people), educational services (1,811), and health care and social assistance (1,783). Those are the sectors residents work in, not jobs necessarily located in Kirkwood. This is a commuter suburb feeding the wider St. Louis job base, including the Clayton and Central West End corridors.
That profile points to long-term tenants with steady incomes, which supports lease stability. It does not support higher rents than the comps show. One wrinkle: RentCafe shows 7.57% rent growth from $1,454 to $1,564 for large complexes, while Zumper shows the average flat year over year. Those are different building sets, so underwrite to the flatter figure until your own leases say otherwise.
Working DSCR brokers see a recurring pattern in high-price, low-yield inner-ring suburbs like this one. Owners anchor on the appraised value and assume the refinance will work, then discover the rent-to-obligation ratio is the binding constraint, not the LTV. The files that move smoothly usually involve small multifamily, or a single-family property held with a lower balance. Running coverage before ordering an appraisal is what prevents the surprise.
How the Cash-Out Mechanics Apply Here
Cash-out DSCR programs typically cap leverage at 75% of appraised value. Ownership seasoning is commonly about six months, measured from title recording. The baseline coverage threshold is 1.00, and reserves typically run about six months of the full monthly obligation, rising above a $1,500,000 loan. Credit tiers generally step up from a 620 floor, with better terms at 660, 680, and 700. Standard programs reach up to $3,000,000, with smaller balances routed through select lenders. All of this is guidance, not a commitment, and depends on the borrower, property, and lender.
Equity available is whatever remains after the payoff and the 75% ceiling, and it’s never a guaranteed figure. In Kirkwood, appreciation helps the value side of that equation. The rent side limits how much the loan can be.
Where the proceeds go matters more than the pull itself. Pulling equity to acquire a duplex near downtown, where coverage can clear 1.00x, is a coherent strategy. Pulling equity from a 0.7x single-family home to buy another 0.7x single-family home is a different decision, and it needs stress-testing. If you have traditional employment income and only a few financed properties, conventional financing may cost less, and the guide “Where DSCR and Conventional Diverge” is worth reading before you commit. DSCR tends to win for LLC-held rentals (subject to lender program eligibility), self-employed investors, or portfolios past conventional limits. For more, see pulling equity with a DSCR cash-out or the broader refi programs overview.
DSCR vs. conventional financing
Two common ways to finance an investment property in Kirkwood, MO. They qualify you differently — here’s how investors weigh them.
Why investors choose it
- Qualifies on the property’s rental income — no personal tax returns, W-2s, or pay stubs needed to document income.
- No personal debt-to-income ceiling to clear, so existing mortgages and obligations don’t cap your borrowing the same way.
- Can be closed in an LLC, keeping the property inside a business entity.
- Built for scaling — not held to the limit on number of financed properties that conventional financing applies.
- Underwriting centers on the deal: generally qualifies when the rent covers the payment, a 1.00x coverage ratio being a common baseline (confirmed in underwriting).
- Designed specifically for investment property, including long-term and, where the program allows, short-term rentals.
Where it’s strong
- Often the lowest ongoing financing cost for a buyer who fully qualifies on personal income — a fit for a first property or a cost-first purchase.
Trade-offs for investors
- Requires full personal income documentation and must fit within a debt-to-income limit — salary, existing debts, and other mortgages all count.
- Typically held in your personal name rather than a business entity.
- Caps how many financed properties you can carry, which can become a ceiling as a portfolio grows.
- Evaluates you as a borrower as much as the property, which usually means more paperwork.
How investors usually choose: a first or single property often optimizes for the lowest financing cost; portfolio builders often optimize for leverage, vesting in an LLC, and scaling past conventional caps. The right answer depends on your goals, the property, and current guidelines — both paths run through select lenders in Lendmire’s wholesale network, with eligibility and terms confirmed in underwriting.
Before relying on local rules or costs, verify current rental requirements, taxes, and insurance with qualified local professionals.
Frequently Asked Questions
How do you qualify for a DSCR cash-out refinance in Kirkwood?
Most programs look at whether the property’s monthly rent covers its full obligation, with a 1.00 baseline common, plus a credit score starting near 620, about six months of reserves, and roughly six months of seasoning. Because Kirkwood prices are high relative to rents, single-family owners should run coverage first. Small multifamily files tend to clear more easily, subject to lender guidelines.
What are the requirements for an investment property loan in Kirkwood, Missouri?
Typical requirements include the property’s rent supporting the payment, credit tiers from a 620 floor upward, reserves, and a loan amount within program range. Cash-out adds the 75% LTV ceiling and ownership seasoning. One-to-four-unit properties are the usual fit. Manufactured homes, log homes, and barndominiums fall outside these programs. Every figure here varies by lender and program — guidelines, property type, leverage, and credit profile all apply.
Is 0.7x coverage on a Kirkwood single-family rental a dealbreaker?
It’s a constraint, not always a dealbreaker. Standard 1.00x programs won’t fit, but some lenders review sub-1.00 structures with lower leverage, stronger credit, or added reserves. Whether that makes sense depends on the appreciation thesis and what the proceeds will do.
Will new downtown apartments hurt my rent comps?
They can. Roughly 212 new units in the downtown core will compete with nearby two- and three-bedrooms, and appraisers may use them as comps. Older stock with lower asking rents, like the Kirkwood Bluffs tier, sits in a different band, so underwrite the specific unit.
Can Lendmire help structure a DSCR cash-out refinance scenario for a Kirkwood rental property?
Yes. Lendmire arranges DSCR investor loans. A cash-out program typically caps leverage at 75% of appraised value. To start, request a scenario quote or call 828-256-2183.
For current guidelines and terms, see Lendmire’s DSCR loan programs page.
About Lendmire
Lendmire is a DSCR-focused mortgage brokerage, NMLS# 2371349, placing investor loans across 41 markets, including Washington, D.C. Lenders generally review DSCR eligibility around a property’s rental income rather than personal income documentation. That fits LLC-held rentals, self-employed investors, and portfolios scaling past conventional financed-property limits. The firm is a 2026 Scotsman Guide Top Mortgage Workplace and was recognized by Scotsman Guide in 2025. Details on Lendmire’s Missouri DSCR platform are available on the state page.
Get Started
Ready to find the right loan for you?
In about 30 seconds you can review financing options available for your investment property. No commitment required.
Informational only. Not a Loan Estimate, approval, or commitment to lend. Program availability and eligibility are subject to lender guidelines, credit approval, property review, and underwriting.
References
1. Redfin, Kirkwood Housing Market
2. Zumper, Kirkwood Rent Research
3. Zillow, Kirkwood Home Values
4. RentCafe, Kirkwood Average Rent
5. Homes.com
7. Webster-Kirkwood Times, Pitman Place
8. FirstAlert4
9. Redfin — Kirkwood Luxury Apartments for Rent
10. Census Reporter, Kirkwood Profile
11. Cubit Planning
13. a 2026 Scotsman Guide Top Mortgage Workplace
14. recognized by Scotsman Guide in 2025
This article is part of Lendmire’s investment property cash-out refinance program — full qualification details, guidelines, and scenarios live on the program page.
Related reading: Luxury Rental DSCR Loans In New Jersey · Jersey Shore Vacation Rental Loans: DSCR Financing In Ocean City, Cape May And Long Beach Island · DSCR Cash-out Refinance In New Jersey: Pulling Equity From A Rental
Guides: Investment Property Cash-Out Refinance in Missouri
Brandon Miller
Founder & CEO, Mortgage Loan Originator, Lendmire LLC
- Mortgage Loan Originator · NMLS# 1129696 · Verify on NMLS Consumer Access
- North Carolina Real Estate Broker · License# 343312 · Verify on NCREC
- North Carolina Insurance Producer · License# 19053198 · Property, Casualty, Life, Health · Verify on NAIC SBS
- Lendmire LLC · Firm NMLS# 2371349 · Verify firm licensure
Disclosure information. Lendmire is a state-licensed mortgage brokerage under NMLS# 2371349. Lendmire is not a depository institution, direct lender, or financial advisor — all loans referenced are placed through wholesale lender partners and are subject to each lender's underwriting standards. This article is provided for general informational purposes and is not a commitment to lend, nor does it constitute financial, legal, or tax advice. Loan programs, terms, rates, and qualification standards change without notice and depend on borrower profile, property type, and the state in which the subject property is located. Equal Housing Opportunity provider. NMLS Consumer Access: nmlsconsumeraccess.org.