
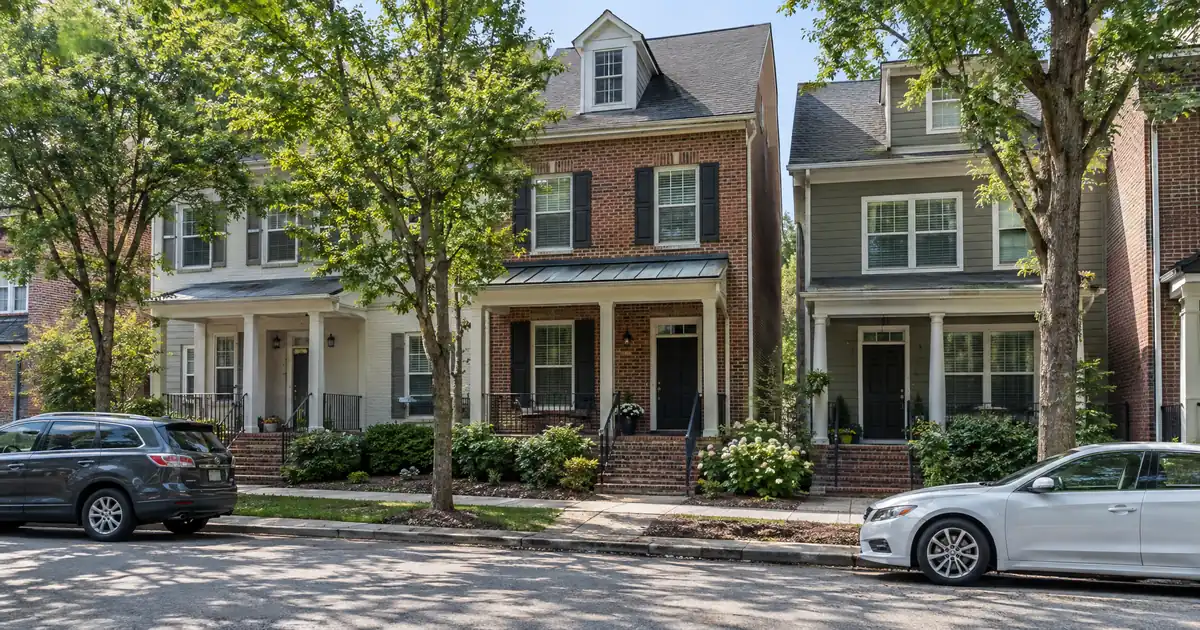
Picture an investor holding a four-bedroom rental in Lakeland Meadows, valued near $448,503 and renting for around $2,090 a month. The plan is a cash out refinance investment property move in Lakeland, Tennessee: pull equity, redeploy it into the next deal. On a spreadsheet, the equity looks generous. Then the coverage math gets run with taxes and insurance included, and the number stops cooperating. That gap between equity and coverage is the whole story in this market, and it decides how much cash you can realistically extract.
The Quick Read: A cash-out refinance on a Lakeland, Tennessee rental is underwritten primarily on the property’s rental income measured against its full monthly obligation, with the lender’s appraised value and a 75% LTV ceiling setting the outer limit on proceeds. In this market, coverage usually binds before LTV does.
DSCR Cash-Out Calculator
Run the cash-out numbers in Lakeland, TN
Rate source: Freddie Mac 30-yr average via FRED® — Federal Reserve Bank of St. Louis · effective Sep 24, 2026
Prefilled with starting assumptions — enter your property’s value, balance, taxes, and insurance for a more accurate picture.
Program parameters update from Lendmire’s centralized guideline source. Taxes and insurance are editable estimates.
As of Sep 24, 2026 · General Freddie Mac market benchmark, not a Lendmire loan offer. Property value, balance, taxes, and insurance are editable estimates. Maximum loan-to-value varies by lender, program, property type, and seasoning. Not a Loan Estimate, approval, or commitment to lend. Program availability and eligibility are subject to lender guidelines, credit approval, property review, and underwriting.
- Gross rent runs roughly 0.45-0.51% of value monthly, thin against typical full-PITIA coverage requirements.
- Zillow’s home value index sits near $448,503, down 1.1% year over year.
- Modeled at 75% LTV with taxes and insurance included, coverage lands well under 1.00x.
- Appreciation has stalled, so appraisal quality, not price gains, drives proceeds.
- Single-family is the only realistic property type here; multi-unit stacking isn’t on the table. Exact terms depend on the lender’s guidelines, property type, leverage, and a full review of the borrower’s file.
Why Coverage Binds Before LTV Does
The 75% LTV ceiling on cash-out is not the constraint that matters in Lakeland. The rent-to-debt ratio is. Homes.com puts median home rent at $2,090 a month, with a price-to-rent ratio of 19.2. Against Zillow’s value, that is about 0.47% of value per month. Zumper’s average rent of $2,285 works out to about 0.51%. Rentometer’s 3-bedroom figure of $2,068 lands in the same neighborhood, though treat that source as directional only. Every figure here varies by lender and program — guidelines, property type, leverage, and credit profile all apply.
Run the numbers this way, as a modeled illustration and not a market fact. Assume $2,090 in rent against a $448,503 value at the full 75% LTV, with coverage calculated on full PITIA (principal, interest, taxes, and insurance). That produces a coverage ratio of roughly 0.8x. Cut leverage to around 50% LTV and the same rent clears about 1.1x. The exact figure moves with the loan terms and the property. Final terms depend on lender guidelines, property type, leverage, and the borrower’s complete credit picture.
So who can actually pull cash? Consider an owner sitting at 45% or 50% of current value. That owner has room to extract a modest amount and still clear 1.00x. An owner already at 60% has essentially nothing to pull, even though the 75% ceiling would technically allow it. Most standard DSCR programs are built around a 1.00x benchmark because rent covers the payment at that level. Some lenders review sub-1.00 files, but those typically need stronger credit, lower leverage, more reserves, or different pricing, and eligibility depends on the lender’s guidelines. For a file below 1.00x, the paths to review are a sub-1.00 program, an interest-only structure, or a lower LTV. Each is subject to credit approval and property review. Investors can walk through those options via Lendmire’s DSCR guide.
Honestly, Lakeland is a premium-rent, low-yield market. It is not a cash-flow play. Owners who bought at lower entry prices, or who have paid balances down, are the ones for whom cash-out works here.
Appreciation Isn’t Coming to Rescue the Equity
Equity extraction usually leans on appreciation. Lakeland doesn’t offer much of it right now. Zillow shows values down 1.1% over the past year. Movoto’s September median list price of $565K is down 3% from a year earlier. NeighborhoodScout reads trailing appreciation at -1.22%. Redfin, by contrast, showed a November median sale price of $460K, up 3.6%. The sources disagree, and the disagreement is informative: values are flat, and which comp set an appraiser pulls matters a lot.
That spread deserves attention. Movoto’s June median sold price of $599,900 runs far above Zillow’s $448K, because large lakefront and estate-style sales skew the median. NeighborhoodScout’s $526,643 sits between. An appraiser valuing a standard 3-4 bedroom home in an interior subdivision is not going to reach for the lakefront numbers.
Then there is the pace of sales. Per Movoto’s market trends, homes averaged 68 days on market in June, up from 39 a year earlier, and sales fell from 106 to 96. September’s median days on market ran to 73. A slower, thinner comp environment means fewer fresh sales for the appraiser and more conservative valuations. Model proceeds at a lower LTV than you’d use in a hot market. Build in a cushion between what you think the house is worth and what the appraisal returns.
Where Cash-Out Files Pencil (and Where They Don’t)
Cash-out works best on lower-basis, lower-balance properties, and Lakeland’s submarkets sort themselves accordingly. The brief has no neighborhood-level rent or price data, so this is a character read, not a rent roll.
Lakeland Meadows and Windward Slopes. These are newer single-family communities, typically owner-occupied. Rentals here are scarce, which cuts both ways: little competition, but comp support for rents is thin too. If you hold a house here bought before values flattened, this is your best equity story. Lakeland Meadows has a community pool and pickleball courts, which help lease-up among long-term tenants.
The Lake District and Canada Road corridor. This is the mixed-use and apartment node, with Lakeland Town Square and The Lake District recently opened. Purpose-built apartments are the likeliest rental supply. The catch for single-family owners nearby: new-build activity around here creates competing supply, which caps rent growth. Underwrite flat.
Cordova and Arlington fringe. Some Lakeland-adjacent listings sit in Cordova subdivisions, and Arlington’s neighboring market may offer cheaper 3-4 bedroom rentals. No data was found, so treat it as a place to scout, not a conclusion. A lower price against similar rent is exactly what improves coverage.
Skip the Garner Lake subdivisions for cash-out. The lake covers 241 acres, and the Garner Lake community site counts six subdivisions with 634 homes, 266 of them lakefront. Access is exclusive to lot owners. It is a premium owner-occupant enclave. Large, expensive homes make coverage nearly impossible, and rental comps barely exist. It is a great place to own and a poor place to underwrite a rental refinance.
No Duplex Playbook Here
Multi-unit stacking isn’t realistic in Lakeland. AreaVibes shows the renter-occupied household share sitting 63% below the national average, and NeighborhoodScout describes a city of large single-family homes. The Homes.com listings show only single-family rentals. No duplex, triplex, or fourplex data turned up.
Underwrite Lakeland as a single-family rental at roughly $2,000 to $2,300 a month. If you want a 2-4 unit thesis, put it in a neighboring market and use Lakeland equity as the funding source. That is a legitimate play: refinance a Lakeland house, deploy the proceeds into a property type that carries better rent-to-value.
What the Memphis Demand Base Actually Supports
Lakeland is a bedroom community, about 20 miles east of Memphis on I-40, with roughly 14,192 residents per Census Bureau QuickFacts. Growth was fast: from 6,862 residents in 2000 to 12,430 in 2010. It has since slowed. Median household income is $113,843, a high-income profile.
Tenant demand rides the metro’s job base, not anything inside city limits. No Lakeland-specific employer list turned up. The metro anchors are FedEx (about 30,000 employees in the metro area, 11,000 at the airport, per a dated HUD market profile), the health systems, and St. Jude’s multi-billion-dollar expansion plan. The FedEx count is dated, so use it directionally.
One forward-looking driver: commercial brokerage IRR expects development to continue in Arlington, Lakeland, and Cordova ahead of Ford’s Blue Oval electric truck plant. It is a plausible tailwind for eastern-corridor rental demand. It is also a source of new competing supply, and the timing is a forecast, not a certainty.
Vacancy Risk Sits Next Door
Here’s the honest caution. Apartment supply across Memphis has been heavy. IRR notes downtown and Midtown saw higher vacancy and subdued rent growth. MMG Real Estate reports effective rents fell 0.2% in 2025, with deliveries projected to drop to 456 units the following year. Supply is easing, but it hasn’t reversed.
Lakeland’s rental inventory is thin and family-oriented, so it is insulated compared with Midtown. Still, apartment competition caps how far Lakeland rents can climb. For a refinance, that means using flat rent assumptions. If the coverage number only works with rent growth baked in, it doesn’t work.
What Deal Desks See on Files Like This
Lendmire’s deal desk sees a consistent pattern in high-price, moderate-rent suburbs. The friction point is almost never credit or seasoning. It is the gap between the owner’s value expectation and the appraisal, combined with coverage that lands just under the benchmark once taxes and insurance are counted. Cleaner files tend to pair a realistic value assumption with a leverage target picked for coverage, not for the 75% cap. Documenting the lease, or a market rent schedule, up front also cuts back-and-forth. Files vested in an LLC are common and reviewed subject to lender program eligibility.
The Mechanics That Matter in Lakeland
Skip the long list of program features. Three parameters do the work on a Lakeland refinance, all typical guidance and subject to lender guidelines.
- Seasoning. About 6 months of ownership, measured from title recording, is the general expectation before a cash-out.
- Leverage. The ceiling on cash-out is 75% LTV. Here, treat it as a limit you will probably stay well under.
- Reserves and credit. Roughly 6 months of PITIA in reserves is typical, and credit tiers generally start at a 620 floor, with better positioning at 660, 680, and 700.
Standard programs handle loan amounts up to $3,000,000, and smaller balances route through select lenders in the network. Nearly every Lakeland single-family file lands well inside that range. Program details change, so confirm current terms before committing. A side-by-side view of DSCR and conventional structures is in the comparison. For the broader mechanics, see the guide “The Refi Options”, which also covers the investment property refinance options. Investors wanting Tennessee context can start at DSCR loans in Tennessee. These specifics are subject to lender guidelines and a full review of property, leverage, and credit.
Using the Proceeds: The Real Test
Here’s the question that decides whether a Lakeland cash-out makes sense: what does the money do next? Pulling equity from a 0.47% rent-to-value asset to buy another 0.47% asset just doubles a thin-coverage problem. The stronger play is redeploying into a higher-yield property type or a higher-yield submarket, where the new asset’s coverage carries itself.
(And if the cash-out itself pushes your existing Lakeland property below 1.00x, you are paying for the extraction with a weaker file.) Run both sides before you commit: coverage on the refinanced asset and coverage on the target.
Reach out to Lendmire at 828-256-2183 or request a scenario review to test the leverage levels before ordering an appraisal.
DSCR vs. conventional financing
Two common ways to finance an investment property in Lakeland, TN. They qualify you differently — here’s how investors weigh them.
Why investors choose it
- Qualifies on the property’s rental income — no personal tax returns, W-2s, or pay stubs needed to document income.
- No personal debt-to-income ceiling to clear, so existing mortgages and obligations don’t cap your borrowing the same way.
- Can be closed in an LLC, keeping the property inside a business entity.
- Built for scaling — not held to the limit on number of financed properties that conventional financing applies.
- Underwriting centers on the deal: generally qualifies when the rent covers the payment, a 1.00x coverage ratio being a common baseline (confirmed in underwriting).
- Designed specifically for investment property, including long-term and, where the program allows, short-term rentals.
Where it’s strong
- Often the lowest ongoing financing cost for a buyer who fully qualifies on personal income — a fit for a first property or a cost-first purchase.
Trade-offs for investors
- Requires full personal income documentation and must fit within a debt-to-income limit — salary, existing debts, and other mortgages all count.
- Typically held in your personal name rather than a business entity.
- Caps how many financed properties you can carry, which can become a ceiling as a portfolio grows.
- Evaluates you as a borrower as much as the property, which usually means more paperwork.
How investors usually choose: a first or single property often optimizes for the lowest financing cost; portfolio builders often optimize for leverage, vesting in an LLC, and scaling past conventional caps. The right answer depends on your goals, the property, and current guidelines — both paths run through select lenders in Lendmire’s wholesale network, with eligibility and terms confirmed in underwriting.
Frequently Asked Questions
How much equity can I realistically pull from a Lakeland rental?
Less than the 75% LTV ceiling suggests. On a modeled $2,090 rent against a value near $448,503, coverage including taxes and insurance runs roughly 0.8x at 75% LTV and about 1.1x near 50%. The practical proceeds ceiling is set by coverage, not the LTV cap, and eligibility remains subject to lender guidelines.
Will an appraiser value my Lakeland house near the lakefront medians?
Only if the property competes with lakefront sales. Movoto’s June median sold price of $599,900 is skewed by large homes and runs well above Zillow’s $448,503. Interior-subdivision homes are typically appraised against similar interior comps, so plan around the lower end of the range.
Does the six-month seasoning clock change if I just bought in Lakeland?
The clock generally runs about 6 months from title recording, so a recent purchase needs to season first. Slower sales here mean a fresh purchase price may carry more weight with the appraiser, but that varies by lender.
Can I stack a duplex or fourplex in Lakeland to improve coverage?
Not realistically. Renter-occupied households sit 63% below the national average, and the housing stock is dominated by large single-family homes. Investors who want multi-unit income usually source it in neighboring markets and fund it with Lakeland equity.
Is Lakeland rent growth strong enough to underwrite increases?
Use flat rents. Zumper’s average of $2,285 reflects a small listing sample, and Memphis-area apartment competition has held effective rents roughly level. Underwrite what the lease says today, not what rents might do later.
The Next Step
Before anything else, pull a comp set. Look at every sold home in Lakeland over the last few months, filter to your bedroom count and subdivision, and note days on market against the 73-day median. That single exercise tells you more about achievable proceeds than any listing-site estimate. In a market where sale prices have slid from $599,900 medians to a $565K list-price median, the appraiser’s comp set is the number your refinance actually rides on.
For current guidelines and terms, see Lendmire’s DSCR loan programs page.
About Lendmire
As a DSCR and non-QM mortgage broker, Lendmire — NMLS# 2371349 — connects investors with wholesale lending channels across 41 markets, including Washington, D.C. Lender review centers on the property’s rental income rather than the borrower’s traditional personal-income documentation, which suits self-employed operators and portfolios beyond four financed properties. Lendmire is a top-ranked workplace in 2026 and a 2025 Scotsman Guide Top Mortgage Workplace, and further company updates appear in Lendmire’s press newsroom. Investors should verify current local rental rules, taxes, and insurance with qualified local professionals.
Get Started
Ready to find the right loan for you?
In about 30 seconds you can review financing options available for your investment property. No commitment required.
Informational only. Not a Loan Estimate, approval, or commitment to lend. Program availability and eligibility are subject to lender guidelines, credit approval, property review, and underwriting.
References
1. Zillow Home Values, Lakeland
2. Homes.com — Lakeland TN Homes for Rent
3. Zumper — Rent Research Lakeland TN
5. Movoto, Lakeland market trends
8. AreaVibes
9. Census Reporter, Lakeland, TN profile
10. Tennessee Demographics, Lakeland
11. HUD PD&R Memphis Housing Market Profile
12. IRR Memphis Multifamily Viewpoint
13. MMG Real Estate
14. Scotsman Guide — Top Workplaces 2026
15. a 2025 Scotsman Guide Top Mortgage Workplace
This article is part of Lendmire’s investment property cash-out refinance program — full qualification details, guidelines, and scenarios live on the program page.
Related reading: DSCR Cash Out Refinance in Lakeland, Tennessee: Can the Rent Cover a Bigger Loan? · Cash Out Refinance Investment Property Lakeland Florida · DSCR Cash Out Refinance in Brentwood, Tennessee: How the Rent Math Clears at 75% LTV
Guides: Investment Property Cash-Out Refinance in Tennessee
Brandon Miller
Founder & CEO, Mortgage Loan Originator, Lendmire LLC
- Mortgage Loan Originator · NMLS# 1129696 · Verify on NMLS Consumer Access
- North Carolina Real Estate Broker · License# 343312 · Verify on NCREC
- North Carolina Insurance Producer · License# 19053198 · Property, Casualty, Life, Health · Verify on NAIC SBS
- Lendmire LLC · Firm NMLS# 2371349 · Verify firm licensure
Disclosure information. Lendmire is a state-licensed mortgage brokerage under NMLS# 2371349. Lendmire is not a depository institution, direct lender, or financial advisor — all loans referenced are placed through wholesale lender partners and are subject to each lender's underwriting standards. This article is provided for general informational purposes and is not a commitment to lend, nor does it constitute financial, legal, or tax advice. Loan programs, terms, rates, and qualification standards change without notice and depend on borrower profile, property type, and the state in which the subject property is located. Equal Housing Opportunity provider. NMLS Consumer Access: nmlsconsumeraccess.org.