
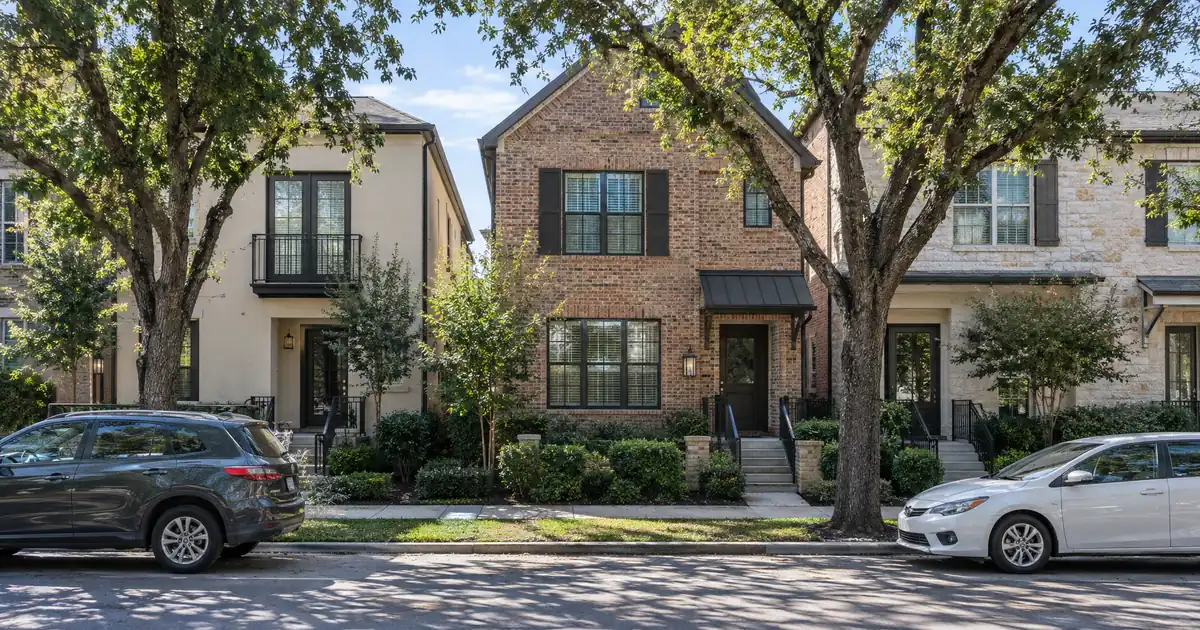
The southwest corridor along Bedford–Euless Road is where Bedford’s rent-to-price math is least bad. Apartments.com describes it as the city’s most accessible entry-price pocket. Listing snapshots on Movoto show 3-bed homes in the low-to-mid $200Ks in the 76022 ZIP. In 76021, to the north, comparable bedroom counts list between $360,000 and $405,000. Those are listings, not medians. They still frame the central problem for any investor holding a Bedford rental and thinking about pulling equity: rents here barely move with price, so the amount of cash a refinance can release depends far more on what the property rents for than on what it appraises for.
DSCR Cash-Out Calculator
Run the cash-out numbers in Bedford, TX
Rate source: Freddie Mac 30-yr average via FRED® — Federal Reserve Bank of St. Louis · effective Sep 24, 2026
Prefilled with starting assumptions — enter your property’s value, balance, taxes, and insurance for a more accurate picture.
Program parameters update from Lendmire’s centralized guideline source. Taxes and insurance are editable estimates.
As of Sep 24, 2026 · General Freddie Mac market benchmark, not a Lendmire loan offer. Property value, balance, taxes, and insurance are editable estimates. Maximum loan-to-value varies by lender, program, property type, and seasoning. Not a Loan Estimate, approval, or commitment to lend. Program availability and eligibility are subject to lender guidelines, credit approval, property review, and underwriting.
The Short Version:
A DSCR cash-out refinance on a Bedford, Texas rental is underwritten primarily on the property’s rental income measured against its full monthly obligation, rather than the owner’s personal income documents, with proceeds limited by a 75% loan-to-value ceiling, roughly six months of seasoning, and lender review of the appraisal and rent schedule.
- Median sale price near $382K against a $2,485 median house rent puts gross rent-to-price near 0.65%.
- On median-priced homes, the coverage ratio typically binds before the 75% LTV cap does.
- ZIP 76021 and ZIP 76022 post nearly identical rents, so lower-priced stock covers better.
- Seasoning runs about six months from title recording. Reserves run about six months of PITIA.
Bedford Market Snapshot
A quick read on the Bedford investor landscape — figures come from the cited sources below. Confirm current property-level numbers before underwriting.
| Metric | Detail |
|---|---|
| Home prices | 156 sales in may (Redfin Bedford Housing Market) |
| Typical rents | $1,502 (Zip-codes.com, ZIP 76021) |
| Recent appreciation | +3.3% yoy (Redfin Bedford Housing Market) |
| Employment | 1,300+ employees (GuideStar, Texas Health HEB) |
| Vacancy | 3.67% (Zip-codes.com, ZIP 76021) |
Why the Coverage Number Binds Before LTV Does
On a median-priced Bedford home, the 75% LTV ceiling is not the limiting factor. The limit is whether rent covers the new, larger loan’s full carrying cost. Final terms depend on lender guidelines, property type, leverage, and the borrower’s complete credit picture.
Start with the market’s own figures. Redfin puts the median sale price at $382K, up 3.3% year over year, at $212 per square foot. Zumper puts the median house rent at $2,485, and Rentometer shows 3-bedrooms at $2,470. Divide rent by price and the gross monthly yield is about 0.65%. That is arithmetic on sourced inputs, not a published Bedford statistic. It sits well under the 1% rule of thumb.
Run the numbers on a modeled case. These are assumptions, not cited market data. Take a property appraising near the $382,000 median, a cash-out at 75% LTV, and rent at $2,485. Once the coverage calculation includes taxes and insurance, the ratio lands just under 1.00x, around 0.95x. The standard benchmark across most DSCR programs is 1.00x, because rent covers the obligation at that level. Some lenders review lower ratios, but those files typically need lower leverage, different pricing, or more compensating strength. A file at 0.95x might still be placed under a sub-1.00 program or an interest-only structure. Either is an option a lender would review, not something the file is entitled to, and qualification stays subject to lender guidelines, credit approval, and property review.
Now change the property. Assume an older home appraising in the low-to-mid $200Ks and renting near the $2,350 three-bedroom benchmark from Zumper. The same 75% cash-out lands around 1.2x including taxes and insurance. Drop the assumed rent to $2,000 and coverage compresses to the low-1.0s. That sensitivity is the point. A smaller house with a clean rent schedule can support a larger percentage pull than an expensive house in a better-looking address. (Few investors price it that way until they see the ratio on paper.) These specifics are subject to lender guidelines and a full review of property, leverage, and credit.
This is also why equity is never a fixed figure. Available cash depends on rent used for lender review, full PITIA, reserves of about six months, and the 75% ceiling together. Cash-out proceeds are whichever of those constraints bites first.
Two ZIPs, Nearly Identical Rent
Bedford’s two ZIP codes rent alike but price differently, and that gap is where the refinance case gets made or lost. ACS-based data from zip-codes.com shows median gross rent of about $1,502 in 76021 and $1,500 in 76022, a difference of two dollars. The 2024 median home value in 76021 is $374,400. Data USA puts the citywide ACS median property value at $350,700. That figure is owner-reported, which is why it runs below Redfin’s sale-price median.
Coverage, then, comes from where the investor sits in the price band, not from choosing a “better” ZIP. A property bought or held at a lower basis carries a smaller loan against the same rent.
Vacancy splits the two sharply, with a caveat. The ACS vacancy figure is 3.67% in 76021 and 10.42% in 76022, per the same zip-codes.com pages. That number includes seasonal and for-sale units, so it is not a rental-only vacancy rate. It is the only sourced vacancy signal in the research, and it deserves treatment as a directional flag. An investor in 76022 should expect the lender to ask for a seasoned lease, or a market-rent schedule backed by comps, and should underwrite with a more conservative vacancy factor. 76022 is also 52.47% renter-occupied against 48.25% in 76021, so the tenant pool is deep even where vacancy reads higher.
There is a thin-sample warning too. Zumper flags Brookwood Hills rents down 58.9% year over year to $1,438, but across only 16 rentals. That is a caution about small samples, not a trend. Citywide, rents are flat to soft: RentCafe shows the average apartment rent at $1,338, down 0.64%, and Zumper shows average rent down 8%. Neither supports pricing a refinance on rent growth. Terms vary by lender guidelines, property type, leverage, credit profile, and full file review.
Reading the Rent Benchmarks Correctly
The rent figure you choose changes the loan, so the choice deserves attention. The sources disagree for good reason, mostly property-type mix:
| Source | Figure | What it measures |
|---|---|---|
| RentCafe | $1,338 average | Apartment complexes, 50+ units |
| Zumper | $2,485 median | Houses |
| Zillow Rental Manager | $2,200 average | Mixed stock |
| Rentometer | $2,470 (3BR) | All property types |
A single-family borrower who quotes the RentCafe figure understates the property. One who quotes the Zumper house median overstates a small, older home. The lender will look past the portal and rely on the appraiser’s Form 1007 rent schedule and local comps. Anchor the pro forma there before the application goes in.
Small Multifamily: A Scarcity Play
Multi-unit income stacking helps coverage in theory, but Bedford’s duplex and triplex inventory is thin enough that the case is mostly about scarcity. A Zillow search for Bedford duplexes and triplexes for sale returned zero homes at the time of the research, and Apartments.com showed only three duplexes listed for rent. These are point-in-time snapshots, not a market count.
For an investor who already owns a small multifamily property, that scarcity helps in one way. It limits competing supply. It also hurts in another: few comps make the appraisal and rent schedule harder to support. Expect the lender to lean hard on the unit-level leases. Investors sourcing a next deal with the proceeds will probably look in adjacent Mid-Cities submarkets, not inside Bedford.
RentCafe shows 74% of rentals sit in complexes under 50 units, 12% in larger buildings, and 13% in single-family rentals. Most of the small-building stock is the older apartment inventory along Central Drive.
Townhomes fill part of the gap. Apartments.com reports an average townhome rent of $2,000, ranging from $1,345 to $2,750, with Bedford Meadows and Shady Brook among the named areas. That is close to single-family rent at usually lower purchase prices, which helps the ratio. The condition that comes with it: HOA dues sit inside the carrying cost and add to the monthly obligation the lender compares against rent.
Demand Anchors: Hospital, Blood Bank, and a Renter Majority
Bedford’s tenant demand rests on health care and a steady renter base. It does not rest on a university. There is no significant college in the city. Data USA’s largest local institution by degrees is a cosmetology school with 83 awards, so student housing is not the pitch.
What the city has instead: Data USA reports health care and social assistance as the largest industry at 3,130 workers, with transportation and warehousing at 2,780 and educational services at 2,739. Total employment of 26.2k slipped 2.08% year over year, which is another reason to size on in-place income, not growth. Texas Health Resources tops the employer list at 1,480, with Carter BloodCare second at 961, per the city’s financial report as reproduced on Wikipedia. That count deserves verifying against the primary document before quoting it. Carter BloodCare is headquartered here and supplies more than 200 hospitals.
DSCR vs. conventional financing
There are two common ways to finance an investment property in Bedford, TX, and they qualify you differently — here’s how investors weigh them.
Why investors choose it
- Qualifies on the property’s rental income — no personal tax returns, W-2s, or pay stubs needed to document income.
- No personal debt-to-income ceiling to clear, so existing mortgages and obligations don’t cap your borrowing the same way.
- Can be closed in an LLC, keeping the property inside a business entity.
- Built for scaling — not held to the limit on number of financed properties that conventional financing applies.
- Underwriting centers on the deal: generally qualifies when the rent covers the payment, a 1.00x coverage ratio being a common baseline (confirmed in underwriting).
- Designed specifically for investment property, including long-term and, where the program allows, short-term rentals.
Where it’s strong
- Often the lowest ongoing financing cost for a buyer who fully qualifies on personal income — a fit for a first property or a cost-first purchase.
Trade-offs for investors
- Requires full personal income documentation and must fit within a debt-to-income limit — salary, existing debts, and other mortgages all count.
- Typically held in your personal name rather than a business entity.
- Caps how many financed properties you can carry, which can become a ceiling as a portfolio grows.
- Evaluates you as a borrower as much as the property, which usually means more paperwork.
How investors usually choose: a first or single property often optimizes for the lowest financing cost; portfolio builders often optimize for leverage, vesting in an LLC, and scaling past conventional caps. The right answer depends on your goals, the property, and current guidelines — both paths run through select lenders in Lendmire’s wholesale network, with eligibility and terms confirmed in underwriting.
The hospital itself, Texas Health Harris Methodist Hospital Hurst-Euless-Bedford, sits in 76022. GuideStar lists more than 1,300 employees and a Level III trauma designation. Bed counts conflict across sources, so none is used here. Nurses and allied staff form a stable tenant pool, and the rentals closest to that campus are the best-supported demand pocket in the higher-vacancy ZIP. That is an inference from the sourced facts, not a sourced rent premium.
Household fundamentals back up the renter base. Point2Homes cites median household income of $83,971. RentCafe puts 10,206 households, 49%, as renters. Bedford is a near-half-renter town carrying a $382K median price, and that tension is the whole DSCR story.
What the File Looks Like From the Desk
The documents that matter on a Bedford cash-out are the same few every time. A current lease or an appraiser’s Form 1007 rent schedule. Insurance declarations showing the full premium. Title and recording evidence for the six-month seasoning clock, measured from title recording. Proof of reserves, about six months of PITIA. Borrower credit, with a 620 floor and better pricing tiers at 660, 680, and 700, all subject to lender guidelines. Vesting in an LLC is common among investors, subject to lender program eligibility, and an entity adds its own paperwork.
On files from older inner-ring suburbs like this one, the common friction point is property condition, not borrower strength. Roofs, HVAC, and foundations draw appraiser attention when the stock dates to the 1980s, and Point2Homes shows 40% of Bedford’s rental units were built between 1980 and 1989. Condition items flagged in the appraisal can force a repair or hold-back conversation before the deal works. The cleaner files tend to arrive with a recent roof or HVAC invoice and a rent schedule that matches in-place leases. Investors can start the conversation at DSCR loans in Texas or walk through Lendmire’s DSCR guide first.
Appreciation Is Not the Plan
Bedford is a steady, cash-flow-and-renovation market, not an appreciation-led one. Redfin’s 3.3% year-over-year price gain is modest, and a secondary source describes the market as essentially flat after several years of rapid gains. A multifamily sponsor’s market note from Rise48 Equity reaches the same conclusion, describing value as coming from execution and renovation rather than new development or population growth. It is a promotional source, so treat it as a qualitative cross-check.
The consequence for a cash-out is straightforward. Size the loan on today’s appraised value and today’s rent. Don’t underwrite on expected gains. Where equity needs to be created rather than harvested, value-add work on an older property is the more realistic route. A property bought below the median, renovated, and re-rented, then refinanced after seasoning, produces equity through basis and rent, not through the market. Weighing that against simply holding is a genuine toss-up for some owners. The harvest is smaller, but so is the carrying risk.
The refinance side and cash-out refinance details cover the mechanics. For the comparison against bank financing, see the guide “Where DSCR and Conventional Diverge”. Investors should also verify current local rental rules, taxes, and insurance with qualified local professionals before sizing any pull.
To talk through a specific property, investors can talk through the numbers or call 828-256-2183.
Frequently Asked Questions
Does Bedford’s 0.65% rent-to-price ratio rule out a DSCR cash-out?
No, but it shifts which properties work. At the $382K median, coverage on a 75% cash-out lands just under 1.00x in a modeled case, so the file would typically need lower leverage or a sub-1.00 program that a lender would review. Homes priced in the low-to-mid $200Ks against comparable rents clear more easily. Qualification remains subject to lender guidelines and property review.
Which Bedford ZIP is better for a cash-out refinance, 76021 or 76022?
Neither is better on rent, since median gross rent is about $1,502 and $1,500. The difference is basis and vacancy: 76021 shows a 3.67% ACS vacancy figure and higher values, while 76022 shows 10.42% with cheaper stock. Lower-priced 76022 homes may cover better on paper, but expect the lender to scrutinize the rent schedule more closely.
How long must I own a Bedford rental before cashing out?
About six months, measured from title recording, is the typical seasoning requirement. A property bought and renovated recently needs the clock to run before a cash-out, unless the lender offers a different structure. Check the recording date on your deed first. The date on your closing statement can differ.
Can a Bedford townhome or half-duplex support a cash-out?
Often, yes, and townhomes may cover better than houses because purchase prices run lower against rents near $2,000. HOA dues count toward the monthly obligation, so they reduce coverage. Duplex inventory is very thin, which can leave an appraiser with few comps for the rent schedule.
Does the older housing stock create problems at appraisal?
Yes, it can. With 40% of rental units built in the 1980s, roof, HVAC, and foundation conditions draw appraiser attention. Condition items noted in the appraisal may need repair or documentation before the lender proceeds, so gather invoices and inspection records up front.
For current guidelines and terms, see Lendmire’s DSCR loan programs page.
Get Started
Ready to find the right loan for you?
In about 30 seconds you can review financing options available for your investment property. No commitment required.
Informational only. Not a Loan Estimate, approval, or commitment to lend. Program availability and eligibility are subject to lender guidelines, credit approval, property review, and underwriting.
About Lendmire
Lendmire (NMLS# 2371349) is a DSCR-focused mortgage broker that helps arrange investor financing across 41 markets, including Washington, D.C., through wholesale and investor-lending channels. DSCR eligibility is generally reviewed by the lender on the property’s rental income rather than personal income documentation, subject to lender guidelines, which works for self-employed investors, LLC operators, and portfolios above four financed properties. Scotsman Guide named Lendmire a Top Mortgage Workplace in both 2025 and 2026.
If you only take one thing from this piece, it’s this: in Bedford the 75% LTV ceiling is rarely the constraint, rent against full carrying cost is, so the equity worth pulling sits in the lower-priced, well-documented rentals and not the median-priced ones. Exact terms depend on the lender’s guidelines, property type, leverage, and a full review of the borrower’s file.
This article is part of Lendmire’s investment property cash-out refinance program — full qualification details, guidelines, and scenarios live on the program page.
Related reading: Cash Out Refinance Investment Property in Bedford, Texas: The 2026 DSCR Financing Guide to Harwood Road · Investment Property Loans in Houston, TX: Where Coverage Clears Beyond the Loop · DSCR Cash Out Refinance in Euless, Texas: The 2026 DSCR Cash-Out Guide to the SH 183 Corridor
Guides: Investment Property Cash-Out Refinance in Texas
References
1. Movoto
2. Freddie Mac 30-yr average via FRED® — Federal Reserve Bank of St. Louis
3. $382K
7. GuideStar, Texas Health HEB
8. Rentometer
9. Data USA
10. RentCafe
11. Apartments.com
12. RentCafe
Brandon Miller
Founder & CEO, Mortgage Loan Originator, Lendmire LLC
- Mortgage Loan Originator · NMLS# 1129696 · Verify on NMLS Consumer Access
- North Carolina Real Estate Broker · License# 343312 · Verify on NCREC
- North Carolina Insurance Producer · License# 19053198 · Property, Casualty, Life, Health · Verify on NAIC SBS
- Lendmire LLC · Firm NMLS# 2371349 · Verify firm licensure
Important disclosures. Lendmire (NMLS# 2371349) is a licensed mortgage brokerage. Lendmire is not a direct lender, depository institution, or financial advisor. All loan inquiries are subject to lender underwriting; this article does not constitute a commitment to lend. Rates, terms, and program guidelines are subject to change without notice and vary by borrower profile, property type, and state. Information in this article is general in nature and is not financial, legal, or tax advice. Equal Housing Opportunity. NMLS Consumer Access: nmlsconsumeraccess.org.