
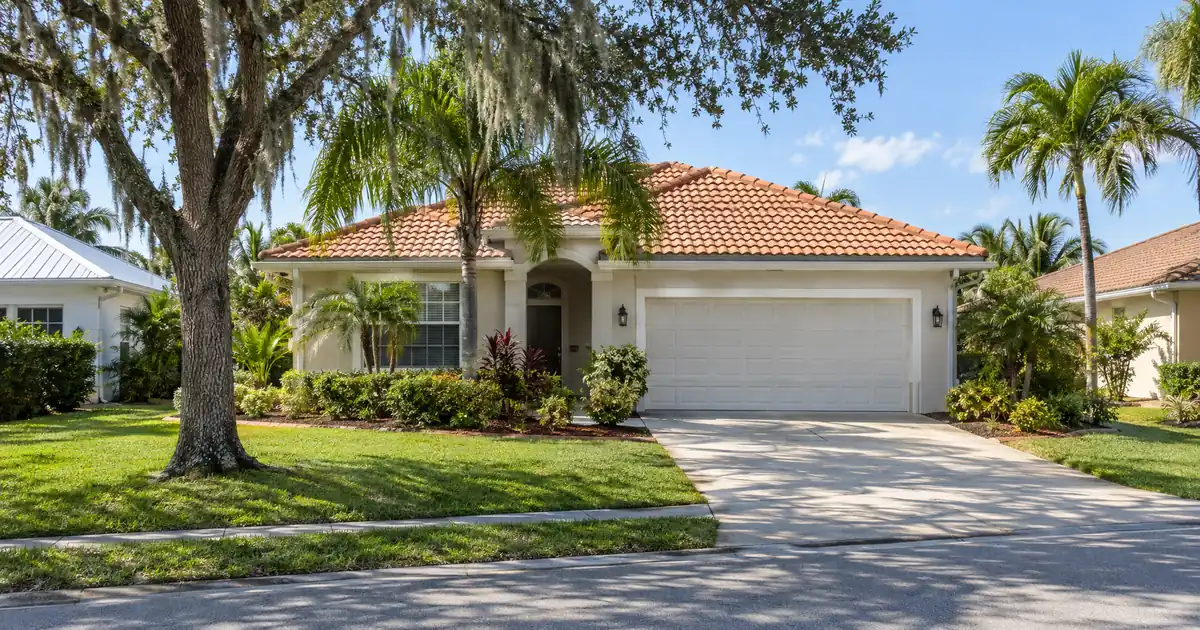
Redfin’s median sale price for Cape Coral rose 5.5 percent over the twelve months ending July 2026, landing at $380,000 with price per square foot up 3.1 percent to $219 — while over the same stretch, Zillow’s home value index shows the average home value at $337,507, down 5.0 percent. Two respected data sources, same city, opposite direction. That gap is the single most important fact for any investor pulling equity out of a Cape Coral property right now, because it means the number on the appraisal depends heavily on which comps the appraiser pulls and when.
The Short Version: A Cape Coral cash-out refinance is underwritten primarily on the property’s rental income measured against its full monthly carrying cost, not on the owner’s personal income, and the strongest cash-flow candidates sit in the interior workforce grid rather than the canal-front premium tier.
DSCR Cash-Out Calculator
Run the cash-out numbers in Cape Coral, FL
Rate source: Freddie Mac 30-yr average via FRED® — Federal Reserve Bank of St. Louis · effective Sep 17, 2026
Prefilled with starting assumptions — enter your property’s value, balance, taxes, and insurance for a more accurate picture.
Program parameters update from Lendmire’s centralized guideline source. Taxes and insurance are editable estimates.
As of Sep 17, 2026 · General Freddie Mac market benchmark, not a Lendmire loan offer. Property value, balance, taxes, and insurance are editable estimates. Maximum loan-to-value varies by lender, program, property type, and seasoning. Not a Loan Estimate, approval, or commitment to lend. Program availability and eligibility are subject to lender guidelines, credit approval, property review, and underwriting.
- NE Cape Coral two-bedroom rentals run $1,400-$1,700, per market data, against lower acquisition cost than waterfront product.
- SW Cape canal-front rents run $2,200-$3,000, but purchase price premiums outpace the rent premium for coverage purposes.
- Florida cash-out refinances follow the general 75 percent LTV cash-out ceiling.
- Six months of title-recorded ownership is the standard seasoning clock before cash-out proceeds become available.
- Cape Coral’s DSCR range on canal-front product runs roughly 0.85 to 1.10 depending on submarket and price paid.
Cape Coral Market Snapshot
A quick read on the Cape Coral investor landscape — figures come from the cited sources below. Confirm current property-level numbers before underwriting.
| Metric | Detail |
|---|---|
| Home prices | $380K median (Redfin) |
| Typical rents | $1,691 average (RentCafe) |
| Cap rates | 6.0%-6.2% cap rates (Norada Cape Coral Investor) |
| University enrollment | ~17,000 fsw students (Cape Coral Office of Economic &) |
| Population | 233,025 population (Census Reporter) |
| Employment | 10% job growth over 8 years (Cape Coral Office of Economic &) |
Northeast Cape Coral Is Where the Cash-Out Math Actually Works
Skip the waterfront for a minute. The northeast quadrant of Cape Coral is the most affordable part of the city, and it’s the submarket where a cash-out refinance is most likely to get close to a coverage ratio of 1.00 on documented long-term rent rather than needing STR income to get there.
Two-bedroom rentals in NE Cape run $1,400 to $1,700 a month, according to neighborhood-level rental data, well below the $2,200-$3,000 range commanded by Southwest Cape’s premium boating lots. Combine that rent band with a lower basis price, and the rent-to-value ratio holds up better than almost anywhere else in the city.
Run a modeled scenario using assumptions, not sourced deal data. Take an NE Cape single-family rental valued around $290,000 — below the citywide average value of $337,507 — with a documented 2BR rent of $1,700. At a 70 percent LTV cash-out, using a 30-year amortization at a high-6s assumed rate, plus Florida-average property tax near 0.91 percent of value and insurance near 0.80 percent of value, the full monthly carrying cost lands in a band that puts the coverage ratio around 0.97 — just under the 1.00 benchmark most standard DSCR programs are built around. That’s the honest math on a lot of NE Cape workforce rentals right now: close to breakeven on rent alone, not comfortably above it.
That’s not disqualifying. It’s informative. A file that comes in at 0.97 on long-term rent still has paths forward — a sub-1.00 program structure, an interest-only restructuring that lowers the monthly obligation, or documented short-term rental income blended in where the property and market support it. Which path applies depends on lender guidelines, credit profile, reserves, and the specific property, and none of it is guaranteed before underwriting runs the file.
Lendmire arranges financing through a wholesale network that reviews exactly this kind of borderline-coverage file across submarkets like NE Cape Coral, where rent supports most — but not always all — of the carrying cost on standard long-term-lease documentation.
Investors weighing this submarket should also know that new construction now accounts for more than 30 percent of Cape Coral’s total inventory, and nearly all of that new-build product is priced toward higher-rent tenants rather than workforce renters. That leaves existing single-family homes in interior neighborhoods like NE Cape facing less direct competition from new supply — a structural tailwind for holding rent pricing power on the properties investors already own.
Southwest Cape Coral Runs the Opposite Play
No transition needed here — the contrast is the point. Southwest Cape Coral, anchored by Cape Harbour’s marina village and Tarpon Point’s resort grounds, is the deep-water canal tier where Gulf access defines value. This is an appreciation-led submarket, not a cash-flow-led one, and a cash-out refinance here behaves differently than in NE Cape.
Canal-front SFR and condo product in this tier produces DSCR readings roughly between 0.85 and 1.10 depending on submarket and purchase price, based on published non-QM lender guidance on Cape Coral’s waterfront segment. The wide range matters: at the low end, the file leans on appreciation and equity position rather than current rent coverage; at the high end, documented boating-tourism rental income closes the gap.
Waterfront properties in established Southwest Cape neighborhoods are also expected to stabilize in value faster than areas saturated with new construction, since the deep-water canal lots that define this tier can’t be replicated at scale the way interior grid lots can. For an investor sitting on appreciation from a purchase made several years ago, that stabilization argument is exactly what supports pulling equity now rather than waiting through another price cycle — though it cuts the other way too: homes priced above $500,000, which is where most of this canal-front inventory sits, show meaningful oversupply relative to buyer demand, and that gap between seller asks and buyer offers can complicate the appraisal an investor is counting on for a strong cash-out valuation.
What Happens When Redfin and Zillow Disagree on Your Comps?
The honest answer: the appraiser decides, and the appraiser doesn’t split the difference between two data platforms. Redfin’s median-sale-price trend and Zillow’s home-value-index trend are measuring different things — actual closed transactions in a window versus a modeled estimate across the broader stock — and in Cape Coral right now they’re telling opposite stories.
For an investor planning a cash-out refinance, that divergence is a reason to pull recent, in-neighborhood closed comps before assuming a number, not after the appraisal comes back light. Redfin’s Cape Coral market data shows homes currently selling in around 61 days with roughly one offer on average — a market with some market-rate tension, but not a bidding-war environment where an appraiser has a deep bench of high comps to lean on.
The Seasoning Clock and the 75 Percent Cash-Out Ceiling in Florida
Six months of ownership, measured from the recorded title date, is the standard seasoning window before a cash-out refinance becomes available on Lendmire’s wholesale network — investor refinance options run through this same seasoning logic regardless of property type. That clock exists because lenders want a documented ownership history before releasing equity, and it applies whether the property sits in NE Cape or on a Gulf-access canal in the southwest.
The leverage ceiling is not where Florida gets its own overlay. General non-QM cash-out programs run up to a 75 percent LTV ceiling nationally, and Florida cash-out transactions follow the same 75 percent ceiling on this network — there is no geographic underwriting adjustment and no Cape Coral-specific rule, so the same ceiling applies to every Cape Coral file regardless of submarket. Credit-score tiers on this program generally run from a 620 floor up through 700-plus, with pricing and leverage improving at the higher tiers, and reserve requirements typically run around six months of full monthly carrying cost, stepping up to roughly nine months on loan amounts above $1,500,000. None of these are guarantees — they’re program guidelines subject to lender review, credit profile, and property type, and they can shift file to file.
DSCR files in markets like Cape Coral typically arrive with one of two shapes: either a clean long-term lease showing rent that covers most of the payment on interior grid product, or a canal-front file leaning on STR income documentation to bridge a coverage gap that market rent alone won’t close. The cleanest files from a documentation standpoint have the lease or STR platform statements, entity formation documents, a current title report, and an insurance quote already assembled before the file goes to underwriting — waiting until the lender asks for these is what turns a routine refinance into a stalled one.
Cape Coral’s rent trend also deserves a second look before an investor locks in a coverage assumption. The average apartment rent citywide sits at $1,691, an 11 percent decline from the prior year’s $1,901, according to RentCafe’s Yardi Matrix data, while Zumper’s March 2026 figure puts the median closer to $1,915. That’s a meaningful spread between two rent sources, on top of the price-index spread already noted — which means underwriting a cash-out refinance on last year’s rent comp, without pulling a current one, is a preventable way to get the file kicked back for a rent-schedule update.
Lehigh Acres Is Where Multi-Unit Stacking Actually Works
Cape Coral proper is overwhelmingly single-family and villa product — true duplex and fourplex inventory is genuinely thin inside city limits. Investors who want two-unit or four-unit rent stacking to boost coverage need to look east, to Lehigh Acres, which functions as Cape Coral’s multi-unit annex.
One documented Lehigh Acres duplex listing shows one side leased at $1,800 a month and the other at $1,750, combined against a purchase price of $469,900, according to a brokerage listing summary. That’s meaningfully higher combined rent relative to price than most single-family product achieves inside Cape Coral, and it shows up in the cap-rate data too — duplexes on Urbana Street and Gretchen Ave S in Lehigh Acres are running cap rates near 6.0 to 6.2 percent, per investor market analysis. An investor who already owns a Cape Coral single-family rental and wants to redeploy cash-out proceeds into a second asset with stronger built-in coverage has a legitimate case for looking at Lehigh Acres rather than buying a second Cape Coral SFR. This is exactly the kind of comparison that separates DSCR financing from conventional investment loans — the qualifying metric follows the property’s income wherever that property sits, LLC-titled acquisitions included, subject to program eligibility.
Downtown Cape Coral. Skip It For Now.
Downtown’s median sale price sits at $180,000 over the trailing three months — notably below the citywide $380,000 median — which sounds like an entry-point opportunity until the days-on-market number shows up: 142 days, according to Redfin’s neighborhood data, well above the citywide average of 61. A cash-out refinance depends on a fresh, defensible appraisal, and a neighborhood sitting on inventory for nearly five months doesn’t generate the kind of recent closed-comp density that makes an appraisal reconsideration easy if the number comes in short. Downtown may be worth revisiting once absorption improves, but it’s not the submarket to lean on for a time-sensitive equity pull today.
Why the Anchor Tenant Base Isn’t Going Anywhere
Cape Coral doesn’t have a military base driving its rental demand. What it has is Lee Health, the regional hospital system employing more than 17,000 people across the area, and that employer is actively expanding inside city limits — Cape Coral Hospital’s emergency department added nine new treatment bays for a total of 56 spaces in a January 2026 project, and Lee Health’s board separately approved a 22.7-acre land purchase in the city tied to an ICU expansion plan. That’s a multi-year, capital-committed employment anchor, not a “healthcare is a big sector” generality — and it supports steady long-term-rental demand across the interior grid neighborhoods where hospital and school-district staff actually rent, regardless of what canal-front prices do.
Fifty-seven percent of Cape Coral residents commute outside the city for work, per the city’s own workforce data, reinforcing that this is fundamentally a bedroom community tied to the broader Lee County job base rather than a single-employer town. Unemployment sits at 4.2 percent with job growth of 10 percent over eight years — a steady, unspectacular labor market that supports workforce rental demand without the volatility of a single-industry city.
What This Means Over the Next 6-24 Months
Two market update sources point in a consistent direction that the July median-price rebound also confirms: Worthington Realty’s March 2026 update shows market-rate inventory down 26.4 percent year over year with just 3.8 months of supply, and a separate report shows July 2026’s median at $385,000, up 5.78 percent year over year after 2025’s price correction. Read together, that’s a market tightening back up after an inventory glut — which is a more favorable comp environment for locking in equity now than it was during last year’s oversupply. The exception sits above $500,000, concentrated in Southwest Cape’s canal-front tier, where the gap between what sellers want and what buyers will pay hasn’t closed and appraisal risk remains real. The next 6 to 24 months likely bring continued tightening in the sub-$500,000 workforce tier — the segment that also happens to produce the cleanest coverage ratios — while the premium canal-front market takes longer to work through its supply overhang. Investors sitting on equity from a purchase made before 2025’s correction have a reasonable window to act on the workforce side of the city before that tightening shows up fully in appraised comps.
Investors ready to look at their own numbers can reach Lendmire at 828-256-2183 or review the DSCR qualification mechanics and Lendmire’s DSCR cash-out refinance program details, including DSCR loan options for Florida investors.
Frequently Asked Questions
How is a Cape Coral cash-out refinance underwritten?
Underwriting focuses primarily on the property’s rental income measured against its full monthly carrying cost, rather than the owner’s personal income. The interior workforce grid, like NE Cape Coral, tends to produce the strongest cash-flow candidates, since rent-to-value ratios typically hold up better there than in canal-front submarkets, subject to lender guidelines.
DSCR vs. conventional financing
Two common ways to finance an investment property in Cape Coral, FL. They qualify you differently — here’s how investors weigh them.
Why investors choose it
- Qualifies on the property’s rental income — no personal tax returns, W-2s, or pay stubs needed to document income.
- No personal debt-to-income ceiling to clear, so existing mortgages and obligations don’t cap your borrowing the same way.
- Can be closed in an LLC, keeping the property inside a business entity.
- Built for scaling — not held to the limit on number of financed properties that conventional financing applies.
- Underwriting centers on the deal: generally qualifies when the rent covers the payment, a 1.00x coverage ratio being a common baseline (confirmed in underwriting).
- Designed specifically for investment property, including long-term and, where the program allows, short-term rentals.
Where it’s strong
- Often the lowest ongoing financing cost for a buyer who fully qualifies on personal income — a fit for a first property or a cost-first purchase.
Trade-offs for investors
- Requires full personal income documentation and must fit within a debt-to-income limit — salary, existing debts, and other mortgages all count.
- Typically held in your personal name rather than a business entity.
- Caps how many financed properties you can carry, which can become a ceiling as a portfolio grows.
- Evaluates you as a borrower as much as the property, which usually means more paperwork.
How investors usually choose: a first or single property often optimizes for the lowest financing cost; portfolio builders often optimize for leverage, vesting in an LLC, and scaling past conventional caps. The right answer depends on your goals, the property, and current guidelines — both paths run through select lenders in Lendmire’s wholesale network, with eligibility and terms confirmed in underwriting.
What LTV ceiling applies to Florida cash-out refinances?
Florida cash-out refinances follow the standard 75 percent LTV cash-out ceiling used nationally on non-QM programs. There is no Florida-specific or Cape Coral-specific reduction, and the same ceiling applies to every Cape Coral file regardless of submarket, subject to lender guidelines.
How long must an investor own a property before pulling cash out?
Six months of title-recorded ownership is the standard seasoning window before cash-out proceeds typically become available on Lendmire’s wholesale network. This seasoning logic applies regardless of property type, whether the home sits in NE Cape Coral or on a Gulf-access canal in the southwest.
Why do canal-front properties show a wide DSCR range?
Southwest Cape Coral’s canal-front product produces DSCR readings roughly between 0.85 and 1.10 depending on submarket and purchase price. At the low end, the file leans on appreciation and equity position rather than current rent coverage; at the high end, documented boating-tourism rental income helps close the gap.
Why might Lehigh Acres appeal to a Cape Coral investor with cash-out proceeds?
Cape Coral proper is largely single-family and villa product with thin duplex or fourplex inventory, while Lehigh Acres functions as its multi-unit annex. Duplex listings there show stronger combined rent relative to price, with cap rates near 6.0 to 6.2 percent, offering a legitimate alternative for redeploying proceeds, subject to program eligibility.
For current guidelines and terms, see Lendmire’s DSCR loan programs page.
About Lendmire
Lendmire is a non-QM mortgage brokerage (NMLS# 2371349) arranging DSCR investor loans in 41 markets, including Washington, D.C. DSCR eligibility is generally reviewed around property-level rental income rather than personal income, subject to lender and program guidelines, making it a fit for self-employed investors and LLC-owned portfolios. Lendmire was recognized as a Scotsman Guide Top Mortgage Workplace in 2025 and 2026.
Get Started
Ready to find the right loan for you?
In about 30 seconds you can review financing options available for your investment property. No commitment required.
Informational only. Not a Loan Estimate, approval, or commitment to lend. Program availability and eligibility are subject to lender guidelines, credit approval, property review, and underwriting.
References
1. Zillow – Cape Coral Home Values
2. Best Neighborhoods in Cape Coral FL
3. Redfin – Cape Coral Housing Market
4. RentCafe – Cape Coral Rent Trends
5. Norada Real Estate – Cape Coral Investor Deals 2026
6. Cape Coral Office of Economic &
8. Cape Coral Office of Economic & Business Development – Workforce
9. Zumper – Cape Coral Rent Research
10. Redfin – Downtown Cape Coral Neighborhood
11. Worthington Realty March 2026 Cape Coral Update
12. Scotsman Guide 2025 Top Mortgage Workplace
13. Scotsman Guide 2026 Top Mortgage Workplace
This article is part of Lendmire’s investment property cash-out refinance program — full qualification details, guidelines, and scenarios live on the program page.
Related reading: DSCR Loans Cape Coral: Investor Financing for Canal-Front Properties, Lehigh Acres, Pine Island, Estero & Real Estate Investors · Cash Out Refinance Investment Property in Coral Springs, Florida · Investment Property Loans in Orlando, FL: Where Rent Still Beats the Payment
Guides: Investment Property Cash-Out Refinance in Cape Coral, FL · Investment Property Cash-Out Refinance in Florida
Brandon Miller
Founder & CEO, Mortgage Loan Originator, Lendmire LLC
- Mortgage Loan Originator · NMLS# 1129696 · Verify on NMLS Consumer Access
- North Carolina Real Estate Broker · License# 343312 · Verify on NCREC
- North Carolina Insurance Producer · License# 19053198 · Property, Casualty, Life, Health · Verify on NAIC SBS
- Lendmire LLC · Firm NMLS# 2371349 · Verify firm licensure
Important disclosures. Lendmire (NMLS# 2371349) is a licensed mortgage brokerage. Lendmire is not a direct lender, depository institution, or financial advisor. All loan inquiries are subject to lender underwriting; this article does not constitute a commitment to lend. Rates, terms, and program guidelines are subject to change without notice and vary by borrower profile, property type, and state. Information in this article is general in nature and is not financial, legal, or tax advice. Equal Housing Opportunity. NMLS Consumer Access: nmlsconsumeraccess.org.