
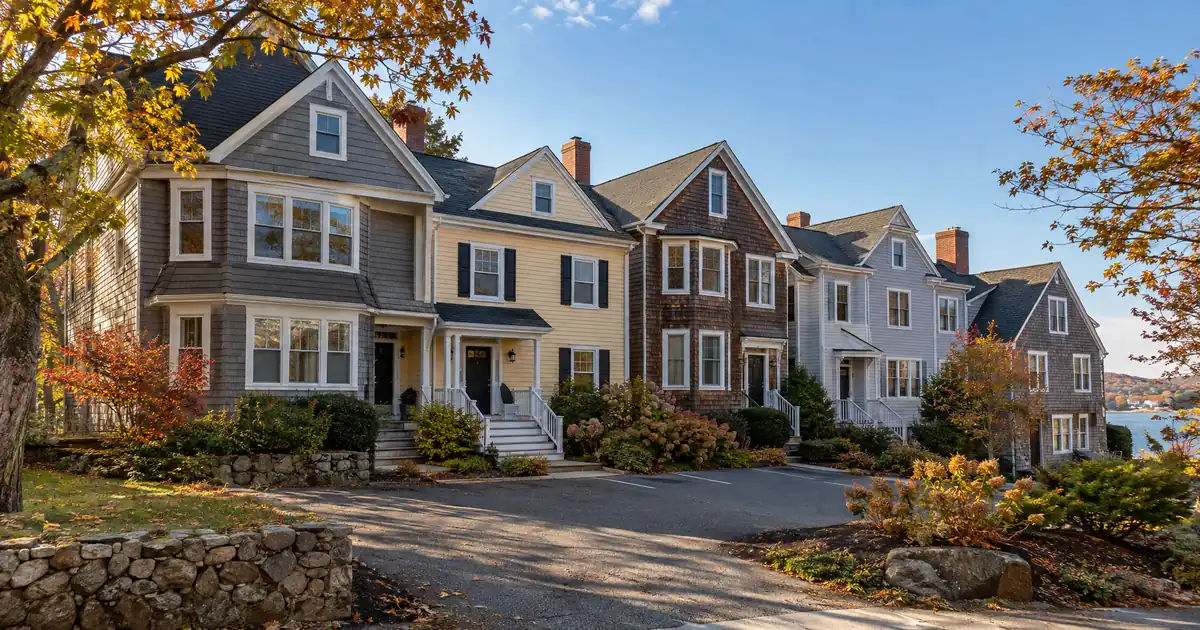
Plymouth investors are sitting on a widening gap. Zillow’s home value index puts the typical Plymouth home at $574,604, up 4.2 percent over the past year, while Zillow’s rental data rates the rental market “COOL” and shows rents down $200 over the same stretch. For owners who bought a few years back, that is a cash-out setup: equity is building on paper, rents are not compounding, and the next 6 to 18 months will reward whoever pulls capital out against the strongest coverage, not the highest appraisal.
DSCR Cash-Out Calculator
Run the cash-out numbers in Plymouth, MA
Rate source: Freddie Mac 30-yr average via FRED® — Federal Reserve Bank of St. Louis · effective Sep 24, 2026
Prefilled with starting assumptions — enter your property’s value, balance, taxes, and insurance for a more accurate picture.
Program parameters update from Lendmire’s centralized guideline source. Taxes and insurance are editable estimates.
As of Sep 24, 2026 · General Freddie Mac market benchmark, not a Lendmire loan offer. Property value, balance, taxes, and insurance are editable estimates. Maximum loan-to-value varies by lender, program, property type, and seasoning. Not a Loan Estimate, approval, or commitment to lend. Program availability and eligibility are subject to lender guidelines, credit approval, property review, and underwriting.
Key Takeaways:
A DSCR cash-out refinance in Plymouth, Massachusetts is underwritten primarily on the property’s rental income measured against its full monthly obligation, capped by a 75 percent loan-to-value ceiling and roughly six months of seasoning. Eligibility remains subject to lender guidelines, credit review, and property review.
- Multi-unit buildings in North Plymouth and downtown carry the coverage case; single-family struggles.
- Zillow shows a cool rental market with rents down $200 year over year. Zillow
- Redfin lists only 8 multi-family homes in town, so appraisal comps run thin. Redfin
- Appreciation, not rent growth, is funding the equity draw.
Plymouth Market Snapshot
A quick read on the Plymouth investor landscape — figures come from the cited sources below. Confirm current property-level numbers before underwriting.
| Metric | Detail |
|---|---|
| Home prices | Median value $446,800 (Data USA, Plymouth CDP) |
| Recent appreciation | +4.2% (Zillow Home Values) |
| University enrollment | Approx. 3,500 students (Quincy College About) |
Equity Is Growing Faster Than Rent
The core tension in Plymouth is simple. Prices have climbed, rents haven’t followed, and the cash-out math has to respect both facts.
Sources disagree on the level of prices, which matters for an equity draw. Zillow’s typical value of $574,604 is an index across all homes. Redfin reports a median sale price of $743K, up 10.8 percent year over year, with homes selling in about 47 days. That is a single-month figure and volatile. Treat the spread, roughly $575K to $745K, as the honest range, and don’t underwrite a specific property off either number.
On the rent side, the sources cluster but don’t match. Zillow shows $2,700 overall, with $2,700 for a two-bedroom and $3,700 for a three-bedroom. RentCafe reports $2,950 (down 1.04 percent), though its data covers only buildings with 50 or more units. Zumper shows $2,900, up 1 percent. RentHop sits at the low end with a $2,325 median across current listings. Flat to slightly soft is the read. Anyone underwriting rent growth is guessing.
Where the 75 Percent Ceiling Meets Plymouth Rents
Multi-unit buildings clear the coverage test in Plymouth, and single-family homes mostly don’t. That is the whole story in one sentence, and the math shows why.
Lenders measure DSCR as monthly rent divided by the full monthly obligation: principal, interest, taxes, insurance, and any dues. Most standard programs use 1.00 as the baseline, though some lenders review lower ratios with compensating factors such as lower leverage or added reserves. Cash-out refinances cap at 75 percent LTV.
Run the numbers on a modeled single-family home at roughly the Redfin median. Assuming a $2,700 rent against a value near $743K, monthly rent runs about 0.36 percent of value. At the 75 percent ceiling and including taxes and insurance, modeled coverage lands around 0.55 to 0.6. Dropping leverage to 50 percent still leaves it under 1.00. This is a modeled assumption, not a sourced deal.
Now a modeled two-unit at a $760,000 appraised value, assuming two 2-bedroom units at Zillow’s $2,700 average, for $5,400 combined. Rent is about 0.71 percent of value. At 75 percent LTV, including taxes and insurance, coverage comes in around the low 1.1s. Not spectacular. Workable.
Sub-1.00 files aren’t dead. A lender may review interest-only structuring, a sub-1.00 program, lower leverage, or extra reserves, depending on the file. Qualification stays subject to lender guidelines, credit approval, and property review.
North Plymouth and Downtown: Where Coverage Holds
North Plymouth, including Cordage Park, is Plymouth’s strongest multi-unit submarket for a cash-out. Homes.com describes bungalows, Cape Cods, and Colonial revivals, many dating to the early 1920s, with newer condos and townhomes mixed in. Average household income is $76,799, pointing to a workforce-renter profile. Listings include an updated three-family and a large two-family with two 3-bedroom, 1.5-bath apartments, walkable to shops, waterfront, and Cordage Park.
Rentometer reports $2,806 for a one-bedroom and $3,452 for a two-bedroom. The data is thin and partial, so use it directionally. If it holds, multi-unit rents here run above the citywide averages, and that is what stretches coverage.
Downtown and Plymouth Center are the second option. Homes.com shows a median home price of $549,000, and Redfin lists a Plymouth Center median rent of $2,700. Small duplexes and mixed-use buildings sit near the harbor. Route 3 access supports the Boston commuter tenant, and Quincy College’s Plymouth campus at Cordage Park adds a modest institutional draw.
This one’s a genuine toss-up between the two. North Plymouth likely offers better rent-to-value; downtown offers better liquidity and resale. An owner choosing which asset to refinance first should pull the one with the lower existing payoff, since the 75 percent ceiling rewards equity depth more than address.
Manomet and West Plymouth: Skip the Premium Coast
Manomet looks attractive on price appreciation and poorly on classic DSCR. NeighborhoodScout models a median price of $662,553 and an average rent of $3,874, with no bedroom breakdown. Vacant homes are a significant characteristic of the area, suggesting seasonal use. That fits seasonal or premium rentals, not workforce DSCR files. Short-term rental treatment varies by lender, so a Manomet file leaning on seasonal income needs a lender conversation before anything else.
West Plymouth, off Route 44 near the Colony Place retail area and Plymouth Industrial Park, is suburban single-family territory: raised ranches, split-levels, and colonials. No neighborhood-level price or rent source turned up, so the case here is qualitative. With single-family coverage weak across town, expect cash-outs there to depend on low basis or deep equity.
Thin Comps, Real Appraisal Risk
Plymouth’s multi-family inventory is small, and that matters for a cash-out more than for a purchase. Homes.com shows listings ranging from $799,900 to $6,975,000, while Redfin shows 8 multi-family homes at a median listing price of $865K. Few comps means appraisers reach for older or wider-radius sales, which can cap the value used for the draw.
Portal medians for the town disagree widely, driven by a small sales sample and a mixed stock from harbor condos to coastal homes. So underwrite from property-specific closed comps. The appraisal, not a portal median, sets the ceiling.
Anchors: Hospital, College, and a Nuclear Wildcard
Demand here rests on a few durable anchors. Per Census QuickFacts, Plymouth’s population reached 65,405 from a 61,216 base, steady growth for a town this size. Beth Israel Deaconess Hospital–Plymouth, a community hospital with roughly 170 to 187 licensed beds and part of Beth Israel Lahey Health, gives the Sandwich Street corridor a steady clinical and support workforce. Quincy College serves about 3,500 students across its Quincy and Plymouth campuses. Plymouth is not a student-rental market.
Then there’s the wildcard. The Plymouth Independent reports that Holtec International owns 1,600 acres tied to the decommissioning Pilgrim Nuclear Station, with the land’s future an open question. It also notes a decline in international visitors hitting heritage tourism. Neither is a confirmed demand driver. Owners shouldn’t underwrite either direction.
Turning Proceeds Into the Next Deal
The mechanics matter more than the pitch. A cash-out typically requires about six months of seasoning from title recording, a 75 percent LTV ceiling, a 1.00 minimum DSCR baseline, and reserves around six months of PITIA (around nine months above $1,500,000). Credit tiers typically run from a 620 floor up through 660, 680, and 700, and standard programs handle balances up to $3,000,000. All of that is guidance, not a promise; details are subject to lender overlays.
Picture an owner whose payoff sits at 50 percent of a two-unit’s appraised value. The ceiling leaves at most 25 points of value in theory, before reserves, costs, and lender review. That draw is not a guaranteed cash figure. If the property is titled in an LLC, that is generally workable subject to lender program eligibility.
DSCR files in markets like this one typically look the same. Coverage on the multi-unit is acceptable but not wide, the appraisal is the swing factor, and the strongest files pair a clean rent schedule with reserves documented before submission. Borrowers who assume last year’s value carries over often find the appraisal resets the conversation. Anyone weighing this against conventional financing can review conventional vs DSCR on investor loans, and the guide “What Is a DSCR Loan” explains the coverage test in detail. Cash-out refinance details and the options for refinancing an investment property cover the structure.
Verify current local rental rules, taxes, and insurance with qualified local professionals before committing to a plan.
Frequently Asked Questions
How do you qualify for a DSCR cash-out refinance in Plymouth?
The property’s rents have to cover its full monthly obligation, with 1.00 the common baseline. Lenders also review credit (620 floor on most tiers), about six months of seasoning, reserves, and the 75 percent LTV ceiling. In Plymouth, the two-to-four-unit buildings in North Plymouth and downtown generally show the strongest coverage. Approval remains subject to lender guidelines.
DSCR vs. conventional financing
Two common ways to finance an investment property in Plymouth, MA. They qualify you differently — here’s how investors weigh them.
Why investors choose it
- Qualifies on the property’s rental income — no personal tax returns, W-2s, or pay stubs needed to document income.
- No personal debt-to-income ceiling to clear, so existing mortgages and obligations don’t cap your borrowing the same way.
- Can be closed in an LLC, keeping the property inside a business entity.
- Built for scaling — not held to the limit on number of financed properties that conventional financing applies.
- Underwriting centers on the deal: generally qualifies when the rent covers the payment, a 1.00x coverage ratio being a common baseline (confirmed in underwriting).
- Designed specifically for investment property, including long-term and, where the program allows, short-term rentals.
Where it’s strong
- Often the lowest ongoing financing cost for a buyer who fully qualifies on personal income — a fit for a first property or a cost-first purchase.
Trade-offs for investors
- Requires full personal income documentation and must fit within a debt-to-income limit — salary, existing debts, and other mortgages all count.
- Typically held in your personal name rather than a business entity.
- Caps how many financed properties you can carry, which can become a ceiling as a portfolio grows.
- Evaluates you as a borrower as much as the property, which usually means more paperwork.
How investors usually choose: a first or single property often optimizes for the lowest financing cost; portfolio builders often optimize for leverage, vesting in an LLC, and scaling past conventional caps. The right answer depends on your goals, the property, and current guidelines — both paths run through select lenders in Lendmire’s wholesale network, with eligibility and terms confirmed in underwriting.
What are the requirements for an investment property loan in Plymouth, Massachusetts?
Expect a property review, documented rents or a market rent estimate, credit review, and reserves near six months of PITIA. Manufactured homes, log homes, and barndominiums fall outside these programs. Balances up to $3,000,000 fit standard programs, with smaller ones routed through select lenders.
Will single-family rentals in Plymouth qualify for a cash-out?
Often not at high leverage. Modeled coverage for a typical single-family home lands well under 1.00, even at lower LTV. Low-basis properties or deep equity can change that, and a lender may review sub-1.00 programs or interest-only structures for those files.
Does the thin multi-family market affect the equity I can pull?
Yes. With only a handful of multi-family listings in town, appraisers lean on limited comps, which can cap the value used. Gathering closed sales for similar buildings before ordering the appraisal helps set expectations.
For current guidelines and terms, see Lendmire’s DSCR loan programs page.
About Lendmire
Lendmire is a DSCR-focused mortgage brokerage, NMLS# 2371349, placing investor loans across 41 markets, including Washington, D.C. Lenders generally review DSCR eligibility around a property’s rental income rather than personal income documentation, which fits LLC-held rentals, self-employed investors, and portfolios scaling past conventional financed-property limits. Lendmire is recognized as a 2026 Scotsman Guide Top Mortgage Workplace and a 2025 Scotsman Guide Top Mortgage Workplace.
With rents flat, values still climbing, and multi-unit coverage sitting only a notch above the baseline, which of your Plymouth properties has the deepest equity cushion and the strongest rent roll to carry your next purchase?
For broader investor-financing rules and property-type coverage across the state, see Massachusetts DSCR loans.
Get Started
Ready to find the right loan for you?
In about 30 seconds you can review financing options available for your investment property. No commitment required.
Informational only. Not a Loan Estimate, approval, or commitment to lend. Program availability and eligibility are subject to lender guidelines, credit approval, property review, and underwriting.
References
3. Redfin
6. Redfin
7. RentCafe
8. Zumper
9. RentHop
10. Homes.com
11. Rentometer
12. Homes.com
14. Homes.com
16. Beth Israel Deaconess Hospital–Plymouth
18. a 2026 Scotsman Guide Top Mortgage Workplace
19. a 2025 Scotsman Guide Top Mortgage Workplace
This article is part of Lendmire’s investment property cash-out refinance program — full qualification details, guidelines, and scenarios live on the program page.
Related reading: Cash Out Refinance Investment Property in Plymouth MA · Cash Out Refinance Investment Property Revere Massachusetts · Cash Out Refinance on New Bedford Investment Property
Guides: Investment Property Cash-Out Refinance in Plymouth, MA · Investment Property Cash-Out Refinance in Massachusetts
Brandon Miller
Founder & CEO, Mortgage Loan Originator, Lendmire LLC
- Mortgage Loan Originator · NMLS# 1129696 · Verify on NMLS Consumer Access
- North Carolina Real Estate Broker · License# 343312 · Verify on NCREC
- North Carolina Insurance Producer · License# 19053198 · Property, Casualty, Life, Health · Verify on NAIC SBS
- Lendmire LLC · Firm NMLS# 2371349 · Verify firm licensure
Disclosure information. Lendmire is a state-licensed mortgage brokerage under NMLS# 2371349. Lendmire is not a depository institution, direct lender, or financial advisor — all loans referenced are placed through wholesale lender partners and are subject to each lender's underwriting standards. This article is provided for general informational purposes and is not a commitment to lend, nor does it constitute financial, legal, or tax advice. Loan programs, terms, rates, and qualification standards change without notice and depend on borrower profile, property type, and the state in which the subject property is located. Equal Housing Opportunity provider. NMLS Consumer Access: nmlsconsumeraccess.org.