
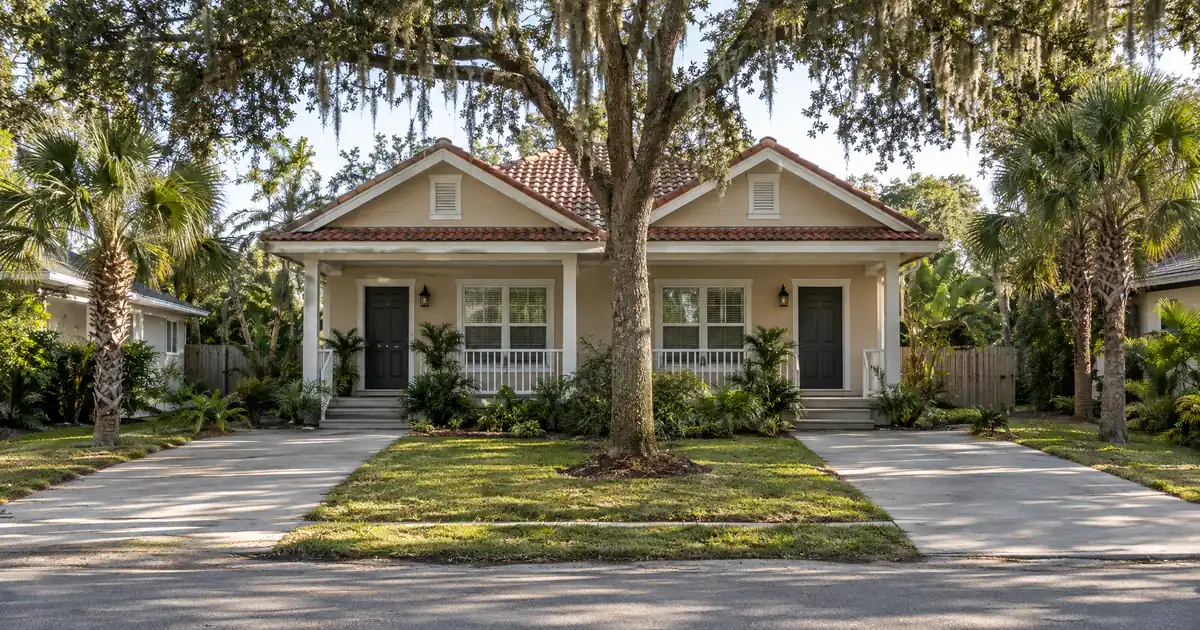
Picture an investor who bought a downtown Sanford duplex for $310,000 a few years ago (a modeled example, not a listing). Both units are leased, the mortgage balance has been paid down, and the property now appraises well above the purchase price. The investor wants that equity working in the next acquisition, not sitting in drywall. The question is how much of it a DSCR cash-out refinance can release, and whether the rent covers the larger payment that follows.
That coverage test is where most Sanford files are decided.
DSCR Cash-Out Calculator
Run the cash-out numbers in Sanford, FL
Rate source: Freddie Mac 30-yr average via FRED® — Federal Reserve Bank of St. Louis · effective Sep 24, 2026
Prefilled with starting assumptions — enter your property’s value, balance, taxes, and insurance for a more accurate picture.
Program parameters update from Lendmire’s centralized guideline source. Taxes and insurance are editable estimates.
As of Sep 24, 2026 · General Freddie Mac market benchmark, not a Lendmire loan offer. Property value, balance, taxes, and insurance are editable estimates. Maximum loan-to-value varies by lender, program, property type, and seasoning. Not a Loan Estimate, approval, or commitment to lend. Program availability and eligibility are subject to lender guidelines, credit approval, property review, and underwriting.
The Short Version:
A DSCR cash-out refinance in Sanford, Florida suits investors holding small multifamily or workforce-priced rentals, because the loan is underwritten primarily on the property’s rental income measured against its full monthly obligation. Duplexes and triplexes clear that test more comfortably than a house at the Zillow typical value of $343,448.
- Cash-out is capped at 75% LTV, with roughly six months of seasoning from title recording.
- Median-priced houses model below 1.00 including taxes and insurance. Duplexes and triplexes land near 1.1 at modeled values.
- Appraisal risk is real: Redfin shows Sanford prices down 6.2% against the same period a year earlier.
- West Sanford’s 32773 prices below downtown 32771’s $355K-$399K median band.
- Exact terms depend on the lender’s guidelines, property type, leverage, and a full review of the borrower’s file.
Sanford Market Snapshot
A quick read on the Sanford investor landscape — figures come from the cited sources below. Confirm current property-level numbers before underwriting.
| Metric | Detail |
|---|---|
| Home prices | $345K median (Redfin Housing Market) |
| Typical rents | $2,100 median (Zillow Rental Manager Market) |
| Recent appreciation | +2.4% yoy (Zillow Home Value Index) |
| University enrollment | 62,211 students (Wikipedia) |
| Population | 66,920 population (Census Reporter) |
Where Does the Equity Come From in a Softening Market?
Sanford owners who bought before the recent plateau hold the most usable equity, but appraisals now carry more risk than they did a few years ago. Zillow’s index shows a typical value of $343,448 and a 2.4% gain over the past year. Redfin reports a $345K median sale price, $204 per square foot, and a 6.2% decline over the latest three months compared with the same three months a year earlier. The two sources disagree on direction, so the sensible conclusion is that Sanford is flat.
For a cash-out file, that matters in a specific way. The 75% LTV ceiling applies to the appraised value, not to what an owner hopes the property is worth. A flat market means the equity you can pull out comes mostly from paydown and from a purchase basis set well below today’s values. It does not come from fresh appreciation. Every figure here varies by lender and program — guidelines, property type, leverage, and credit profile all apply.
Zip codes inside the city diverge too. Zillow’s 32771 read shows an average home value of $363,831, down 2.8% over the year. Per the BKRS Sanford zip guide, downtown 32771 carries a median in the $355K-$399K band, while West Sanford’s 32773 offers newer suburban product west of I-4 at more accessible pricing.
Consider two owners with the same purchase price and the same remaining balance. If one sits downtown and the other in West Sanford, the appraisal outcomes can differ by more than the rent difference between them. That’s an argument for ordering an honest valuation before anyone commits to a refinance plan. It is also why how DSCR cash-out works in practice starts with value, not rent.
Why Duplexes and Triplexes Carry the Cash-Out Math
Small multifamily is where Sanford’s coverage math works. Combined rents from two to four doors stack against one mortgage, while price per unit runs lower than for detached houses. Per city-data.com, mean 2024 prices were $526,211 for detached houses, $250,689 in 2-unit structures, and $177,702 in 3-to-4-unit structures.
Treat those as structure-type averages, not as what a given duplex will appraise at. The direction still holds: the multi-door structure, not the neighborhood, is what makes the loan pencil.
Live listings show the income side. A renovated downtown duplex is marketed with each 2BR/1BA unit renting at $1,500, or $3,000 combined, per Homes.com’s multifamily listings. A three-unit downtown property was marketed as fully occupied with $3,375 in monthly rent, per Homes.com’s Sanford-neighborhood listings. On the Redfin multi-family page, a downtown-adjacent quadplex shows one unit at $1,450 against a $1,600 market rent, with three units vacant. Treat listing rents as asking figures. The lender relies on the appraiser’s rent schedule and any in-place leases.
Now run the numbers. These are modeled assumptions, not sourced values. Each figure is rent divided by full monthly obligation, including taxes and insurance, at 75% LTV. Final terms depend on lender guidelines, property type, leverage, and the borrower’s complete credit picture.
| Scenario (modeled) | Rent | Modeled value | Coverage |
|---|---|---|---|
| Duplex, two units | $3,000 combined | $400,000 | About 1.1 |
| Same duplex, higher appraisal | $3,000 combined | $450,000 | Near 1.0 |
| Triplex, three units | $3,375 combined | $450,000 | About 1.1 |
| Median house, census rent | $1,726 | $343,448 | High 0.7s |
The second row is a tension worth sitting with. A higher appraisal releases more proceeds, but at a 75% LTV it also enlarges the new obligation, so coverage slides toward the benchmark. Many owners focus on maximizing proceeds. The stronger play is often borrowing slightly less than the ceiling to keep the coverage number comfortably above 1.00.
DSCR files in markets like this one typically look like a small multifamily property with a modest existing balance, a thin cushion at the full-leverage ceiling, and a borrower deciding how much of that cushion to spend. The files that go smoothly usually arrive with signed leases, a clear rent schedule, and reserves already documented. The ones that stall tend to hinge on an appraisal that comes in lower than the owner assumed. The usual fix is a lower loan amount, not a new property.
Where Single-Family Houses Fall Short
A median-priced Sanford house usually doesn’t clear 1.00 on a cash-out at full leverage. Census-based city-data.com puts median gross rent at $1,726. Against a house valued near the Zillow typical figure, that models in the high 0.7s with taxes and insurance included. Zillow Rental Manager shows a higher $2,100 median across all property types, with a $500-$4,200 range, though its date metadata is inconsistent, so read it as directional. Even on that rent the model lands in the mid-0.9s.
(That gap between rent sources is itself a signal. Census rent covers all existing leases, while listing rent captures new asks.)
A sub-1.00 file isn’t a dead end, but nothing here is guaranteed. A lender may review a sub-1.00 program, a lower LTV, an interest-only structure, or more cash or reserves as compensating factors. Approval depends on lender guidelines, credit, reserves, and property review. The standard benchmark is 1.00 because rent covers the obligation at that level. Below it, expect tighter terms rather than a closed door.
Houses in Mayfair Meadows-type subdivisions (smaller 2- and 3-bedroom homes, mostly built between 1984 and 1989, on small or zero-lot-line parcels) have a lower acquisition basis than the citywide median. They get closer to the line, but a refinance on one is still a leverage-versus-coverage trade, not an automatic fit.
Which Sanford Pockets Make Sense?
Neighborhood fit comes down to purchase basis, unit count, and how much rent a property can stretch to. Per-submarket rent and price data wasn’t independently verifiable for most of these areas, so the profiles below stay qualitative.
Historic Downtown and Georgetown. The blocks between Sanford Avenue and Park Avenue hold 1920s bungalows, craftsman cottages, and Victorian-era homes, many renovated, alongside a growing restaurant scene. The core historic district counts roughly 2,896 residents. The downtown stock is where the duplex and triplex listings above sit, and where appreciation has the strongest pull. It also has the highest basis, so monthly rent has to stretch further to clear 1.00. Downtown also gets visibility from the Auto Train. Per Great American Stations, Sanford is the southern terminus of the only U.S. motorail service, handling more than 200,000 passengers a year and making it Florida’s busiest Amtrak station. For long-term holders, that mainly means steady foot traffic into the downtown core.
West Sanford (32773). Newer suburban development west of I-4 prices below the downtown ZIP. The investor thesis is simple: workforce single-family and small-unit holdings here likely underwrite better than downtown product, though with less appreciation upside.
Mayfair and Mayfair Meadows. Non-gated homes off H.E. Thomas Jr. Parkway, near the Central Florida Zoo and an entrance to the 417 Expressway. Smaller footprints, garages, and a community pool make for low-maintenance rental stock. Treat it as a coverage-near-the-line play, not a surplus-coverage play.
Goldsboro. Redfin lists it as a distinct submarket alongside Georgetown, Timacuan, and Lake Monroe Waterfront-Downtown. It historically serves as legacy workforce housing with lower entry prices than the lakefront districts. Without verified rent data, an investor should assume nothing and get a rent schedule first.
Honestly, the downtown-versus-West Sanford choice is a toss-up. Downtown wins on appreciation and unit-count options, and West Sanford wins on entry price. Which wins for a given owner depends on whether the next purchase is meant to cash flow or to build equity.
Is the Tenant Base Deep Enough?
Sanford’s rental demand rests on hospital, school, college, and airport employment, which supports long-term occupancy independent of Orlando apartment supply cycles. Per Data USA, the most common resident employment sectors are health care and social assistance (4,136 people), retail trade (3,790), and construction (3,058). The homeownership rate is 52%, so nearly half of households already rent.
The anchors are specific. HCA Florida Lake Monroe Hospital, formerly Central Florida Regional Hospital, is a 221-bed Level II trauma center, per the Seminole County Chamber directory, and has operated since 1982. That produces shift-based renters who need housing near the hospital corridor. Seminole County Public Schools enrolls 62,211 students and employs 3,872 teachers, a stable non-cyclical payroll. Seminole State College sits on more than 200 acres at the Sanford/Lake Mary campus and serves over 20,000 students across its campuses. Orlando Economic Development places Orlando Sanford International on roughly 3,000 acres, with more than 400 acres of non-aviation land identified for development, which points toward continued logistics and distribution payrolls.
Population is moving the right way. Seminole County’s own Esri demographic profile shows Sanford growing from 53,926 in the 2010 Census to an estimated 63,635 in 2024, projected to reach 67,783 within five years.
Now the caution. Per Point2Homes, median renter household income is $48,534 and the rent-to-income ratio is 39.8%. That’s a stretched tenant base, which limits how far rents can climb after a refinance. Plan around current rents, not rent hikes.
On supply, ManageCasa puts statewide Florida rental vacancy near 10%, with metros ranging from about 7% to 12.2%. TrueNorth Managed describes Orlando as stabilizing and about six to twelve months ahead of Tampa in working through its supply wave. Neither is a Sanford-specific vacancy figure, since none was available from an authoritative source. The takeaway is directional: Sanford sits in the stronger part of the Florida supply cycle. New-build competition is active along the northern corridor, with M/I Homes noting 10 new developments in seven years around Lake Mary, Sanford, and Markham Woods.
Seasoning, LTV, and Putting the Proceeds to Work
The parameters that shape a Sanford cash-out are few. Typical guidelines, subject to lender review and not guaranteed, include:
- A cash-out ceiling of 75% LTV on investment property
- About six months of ownership, measured from title recording
- A 1.00 minimum coverage ratio on rent used for lender review against full PITIA
- Credit tiers starting at a 620 floor
- Reserves of about six months of PITIA
- Loan sizes up to $3,000,000 on standard programs
- These specifics are subject to lender guidelines and a full review of property, leverage, and credit.
The available equity depends on rent used for lender review, the payment, reserves, and the 75% ceiling. It is never a guaranteed cash figure.
Here’s an equity illustration in percentages only. Suppose an owner’s existing balance equals 55% of the property’s new appraised value. At the 75% ceiling, the maximum cash-out is about 20 points of value, before costs and before the coverage test is applied. If coverage turns out thin, the lender may review a lower LTV. That trims proceeds but protects the ratio. For an investor with a pipeline of multifamily targets, 20 points of value on a duplex can seed a down payment on the next one. That compounding pattern is the whole point of the structure. Terms vary by lender guidelines, property type, leverage, credit profile, and full file review.
DSCR vs. conventional financing
There are two common ways to finance an investment property in Sanford, FL, and they qualify you differently — here’s how investors weigh them.
Why investors choose it
- Qualifies on the property’s rental income — no personal tax returns, W-2s, or pay stubs needed to document income.
- No personal debt-to-income ceiling to clear, so existing mortgages and obligations don’t cap your borrowing the same way.
- Can be closed in an LLC, keeping the property inside a business entity.
- Built for scaling — not held to the limit on number of financed properties that conventional financing applies.
- Underwriting centers on the deal: generally qualifies when the rent covers the payment, a 1.00x coverage ratio being a common baseline (confirmed in underwriting).
- Designed specifically for investment property, including long-term and, where the program allows, short-term rentals.
Where it’s strong
- Often the lowest ongoing financing cost for a buyer who fully qualifies on personal income — a fit for a first property or a cost-first purchase.
Trade-offs for investors
- Requires full personal income documentation and must fit within a debt-to-income limit — salary, existing debts, and other mortgages all count.
- Typically held in your personal name rather than a business entity.
- Caps how many financed properties you can carry, which can become a ceiling as a portfolio grows.
- Evaluates you as a borrower as much as the property, which usually means more paperwork.
How investors usually choose: a first or single property often optimizes for the lowest financing cost; portfolio builders often optimize for leverage, vesting in an LLC, and scaling past conventional caps. The right answer depends on your goals, the property, and current guidelines — both paths run through select lenders in Lendmire’s wholesale network, with eligibility and terms confirmed in underwriting.
Is refinancing now better than waiting? A cautious investor could argue for waiting to see whether Redfin’s softening reverses. An investor with a sound plan for the proceeds could argue the other way, since waiting costs time, and a lower appraisal can be offset with a smaller loan. Neither side is wrong. What matters is whether the proceeds go to an asset that clears 1.00 by itself.
Refi programs and the guide “What Is a DSCR Loan” are the two explainers most useful before requesting numbers. For statewide context, see DSCR loan options for Florida investors. Investors who want a file reviewed can talk to Lendmire or call 828-256-2183. As always, verify current local rental rules, taxes, and insurance with qualified local professionals. Sanford’s lake and river location makes insurance worth a real conversation with a licensed agent.
Frequently Asked Questions
How do you qualify for a DSCR loan in Sanford?
Qualification centers on the property, not on traditional personal-income documentation. The lender compares the rent used for program review to the full monthly obligation, including principal, interest, taxes, insurance, and any HOA dues, and typically looks for 1.00 or better. Credit (620 floor), reserves of about six months of PITIA, and an appraisal also factor in. Everything remains subject to lender guidelines and property review.
What are the requirements for a cash-out refinance on an investment property in Sanford, Florida?
The common requirements are about six months of ownership from title recording, a maximum 75% LTV, a coverage ratio of at least 1.00, and documented reserves. Loan sizes run up to $3,000,000 on standard programs. Manufactured homes, log homes, and barndominiums fall outside these programs. Exact terms depend on the lender’s guidelines, property type, leverage, and a full review of the borrower’s file.
Does Sanford’s flat-to-softening price trend hurt a cash-out?
It can reduce proceeds, since the 75% cap applies to appraised value. Zillow’s index shows a 2.4% yearly gain while Redfin shows a 6.2% decline, so appraisals can land either side of what an owner expects. Multi-unit properties tend to hold coverage better because rent stacks across doors. If the appraisal disappoints, borrowing less is usually the cleaner response.
Is a downtown duplex or a Mayfair-type house the better cash-out candidate?
The duplex, on coverage. Listing rents of $1,500 per unit on a downtown duplex produce a combined income a single-family rent can’t match at comparable prices. The house usually carries the lower basis and simpler management, but it models below 1.00 at the median value. Choose by which gap you’d rather close.
For current guidelines and terms, see Lendmire’s DSCR loan programs page.
About Lendmire
A DSCR-focused mortgage broker, Lendmire (NMLS# 2371349) places investor financing across 41 markets, covering 40 states plus Washington, D.C. DSCR eligibility is generally reviewed by the lender on property cash flow instead of traditional personal-income documentation, subject to lender guidelines. Scotsman Guide named Lendmire a 2025 Scotsman Guide Top Mortgage Workplace and a 2026 Scotsman Guide Top Mortgage Workplace.
Get Started
Ready to find the right loan for you?
In about 30 seconds you can review financing options available for your investment property. No commitment required.
Informational only. Not a Loan Estimate, approval, or commitment to lend. Program availability and eligibility are subject to lender guidelines, credit approval, property review, and underwriting.
References
1. Zillow Home Value Index, Sanford
2. Redfin Housing Market, Sanford
4. Seminole County Public Schools
7. City-Data.com, Sanford profile
8. Homes.com’s multifamily listings
9. Homes.com’s Sanford-neighborhood listings
13. Seminole County Chamber directory
14. Seminole State College, Sanford/Lake Mary Campus
15. Orlando Economic Development, Orlando Sanford International Airport
16. Seminole County Esri Demographic Profile
17. Point2Homes, Sanford Demographics
18. ManageCasa
20. mihomes.com — Orlando Metro Sanford
21. a 2025 Scotsman Guide Top Mortgage Workplace
22. a 2026 Scotsman Guide Top Mortgage Workplace
This article is part of Lendmire’s investment property cash-out refinance program — full qualification details, guidelines, and scenarios live on the program page.
Related reading: Cash Out Refinance Investment Property in Sanford, North Carolina: What It Takes to Refinance a Sanford Rental · Cash Out Refinance Investment Property Sanford Florida · DSCR Cash Out Refinance in Sanford, North Carolina: What It Takes to Refinance a Sanford Rental
Guides: Investment Property Cash-Out Refinance in Sanford, FL · Investment Property Cash-Out Refinance in Florida
Brandon Miller
Founder & CEO, Mortgage Loan Originator, Lendmire LLC
- Mortgage Loan Originator · NMLS# 1129696 · Verify on NMLS Consumer Access
- North Carolina Real Estate Broker · License# 343312 · Verify on NCREC
- North Carolina Insurance Producer · License# 19053198 · Property, Casualty, Life, Health · Verify on NAIC SBS
- Lendmire LLC · Firm NMLS# 2371349 · Verify firm licensure
Compliance and disclosures. Lendmire (NMLS# 2371349) is a licensed mortgage broker and is not a direct lender, depository institution, financial advisor, or tax professional. Content in this article is general market analysis and educational information — not financial, legal, or tax advice for any specific situation. Lendmire does not guarantee loan approval; every transaction is subject to underwriting by the funding lender. Mortgage pricing and loan program guidelines are subject to change at any time without notice and vary by borrower characteristics, property type, and state regulations. Lendmire complies with Equal Housing Opportunity. Licensure verification: NMLS Consumer Access.