
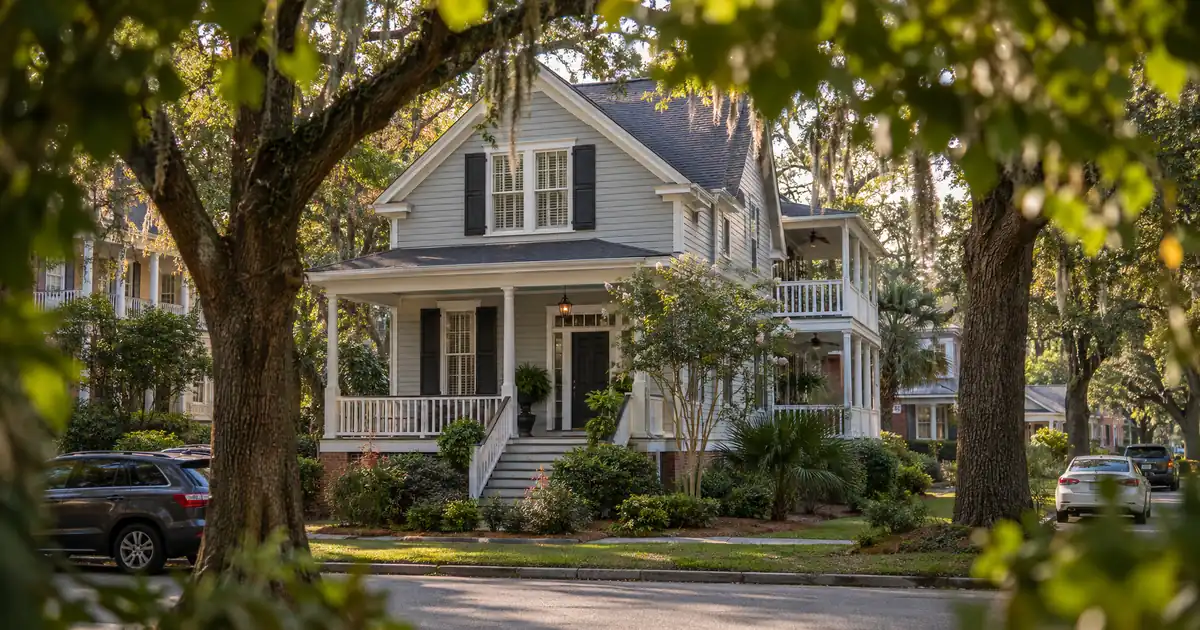
A four-unit building in New Brookland, now appraising well above its purchase basis, hits the DSCR math like this: four modest rents stack into one debt-service test. The owner’s single-family house near Sunset Boulevard has to clear that same test on a single rent. Same owner, same equity goal, very different coverage profile.
That contrast is the core of the West Columbia cash-out question. Lenders size the loan at the lower of the loan-to-value cap and the amount the rents can support. In a city where the appraisal story and the rent story point to different pockets, the property you refinance matters as much as the equity you hold.
DSCR Cash-Out Calculator
Run the cash-out numbers in West Columbia, SC
Rate source: Freddie Mac 30-yr average via FRED® — Federal Reserve Bank of St. Louis · effective Sep 24, 2026
Prefilled with starting assumptions — enter your property’s value, balance, taxes, and insurance for a more accurate picture.
Program parameters update from Lendmire’s centralized guideline source. Taxes and insurance are editable estimates.
As of Sep 24, 2026 · General Freddie Mac market benchmark, not a Lendmire loan offer. Property value, balance, taxes, and insurance are editable estimates. Maximum loan-to-value varies by lender, program, property type, and seasoning. Not a Loan Estimate, approval, or commitment to lend. Program availability and eligibility are subject to lender guidelines, credit approval, property review, and underwriting.
The Short Version: Cash-out refinancing an investment property in West Columbia, South Carolina is underwritten primarily on the property’s rental income measured against its full monthly obligation, so small-building stock where several rents stack against one loan tends to produce the cleanest coverage.
- RentCafe shows 43% of households rent, a deep tenant pool.
- Aggregator rents disagree ($1,502 versus $1,289 averages), so underwrite from the lower figure.
- Cash-out LTV typically tops out at 75%, with about 6 months of seasoning.
- River District product suits equity capture. Older small buildings suit coverage.
How Cash-Out Proceeds Get Sized Here
Proceeds come from whichever limit binds first: the 75% LTV ceiling or the loan amount the property’s rent can carry at a 1.00 coverage baseline. In West Columbia, the rent limit will bind before the LTV limit on many single-family homes. On small multifamily it often does not.
Lendmire (NMLS# 2371349) works with West Columbia, South Carolina investors to place DSCR financing through wholesale lenders reaching 41 markets — 40 states plus Washington, D.C. The brokerage arranges the file. Lenders review eligibility and approve.
Coverage here is monthly rent divided by the full monthly obligation: principal, interest, taxes, insurance, and any HOA dues. Most standard programs are built around a 1.00 benchmark, since rent covers the payment at that level. Some lenders will look below it, but that usually means lower leverage, stronger compensating factors, or different terms. The guide “What Is a DSCR Loan” covers the mechanics.
Typical guideline ranges for this loan type, all subject to lender guidelines and varying by borrower and property:
- Leverage: up to 75% LTV on a cash-out. The 80% figure seen on purchase loans does not apply.
- Seasoning: about 6 months of ownership, measured from title recording.
- Reserves: roughly 6 months of PITIA, rising for larger balances.
- Credit: a 620 floor, with pricing tiers stepping up at 660, 680, and 700.
- Loan size: up to $3,000,000 on standard programs. These specifics are subject to lender guidelines and a full review of property, leverage, and credit.
Extractable equity is never a guaranteed number. An owner whose existing loan sits at 45% of appraised value has room for up to 30 points of value at the 75% ceiling, before costs and reserves. If the rents cannot support that balance, the number shrinks.
What the Rent Data Supports (and Where It Stops)
West Columbia’s renter base is large enough to underwrite against, but the published rent figures come from apartment-focused aggregators, not duplex or fourplex data. Investors should treat them as ceilings for older small buildings.
RentCafe, drawing on Yardi Matrix, puts the average rent at $1,502, up 5.38% from $1,425 a year earlier. By size, a 1BR averages $1,341, a 2BR $1,474, and a 3BR $1,720. It also reports 3,579 renter-occupied households against 4,688 owner-occupied. The largest share of rentals, 44%, falls between $1,001 and $1,500 a month.
Two cautions apply. RentCafe covers only buildings with 50 or more units, so it describes large complexes. And Apartments.com, using CoStar data from an earlier snapshot, shows a lower $1,289 average with rents down 0.2% year over year. One source says mid-single-digit growth. The other says flat.
Which one is right? Probably both, measured on different buildings. The practical read is to underwrite from the lower figure and treat the higher one as upside. It also means an appraiser’s rent schedule can come in under what a listing site suggests.
The 1BR-to-2BR gap is only about $133 on RentCafe’s numbers. A fourplex of 2BR units does not earn dramatically more than one of 1BRs. Household composition points the same way. The Census Bureau’s West Columbia profile is the place to verify, and roughly 40% of households are people living alone. That leans demand toward smaller units. (This is an inference from household data, not a sourced rent finding.)
No reliable vacancy source turned up for West Columbia. Anyone claiming a precise vacancy figure for the city is not working from published data.
The Demand Anchors Behind the Tenant Pool
West Columbia’s rental demand rests on healthcare, state government, and a community college campus, all within a short drive of the city’s core. That mix is steadier than a single-employer town, and it is why long-term rental coverage holds up better here than STR-style logic would suggest.
Per Central SC, the state government employs more than 30,000 people in the Midlands. Blue Cross Blue Shield of South Carolina employs over 10,000 and is the region’s top private employer. Prisma Health and Lexington Medical Center together employ more than 21,000. These are regional figures. Not every job sits inside city limits, but all of them feed the same commuter-rental pool.
Lexington Medical Center sits on Sunset Boulevard in West Columbia and runs a teaching hospital of 600-plus beds. It employs thousands, though headcounts vary by source and no precise figure is used here. Prisma Health, the state’s largest health system, operates its Richland hospital across the river.
Midlands Technical College places its Airport Campus on 65 acres in West Columbia, including a 56,000-square-foot health sciences and nursing facility. Enrollment sources conflict, so no headcount is offered. The University of South Carolina, which Central SC calls the state’s largest university, sits just across the Congaree in Columbia. Fort Jackson and the airport add further workforce demand, though headcounts there were not verified.
Three Pockets Where the Math Splits
The strongest coverage profile in West Columbia belongs to older duplex, triplex, and fourplex stock, and the strongest equity story belongs to the River District. They are not the same place. Neighborhood-level rent and price medians are not published, so the profiles below are qualitative.
| Coverage tendency | Cash-out role | |
|---|---|---|
| New Brookland small buildings | Strongest (stacked rents) | Income-led proceeds |
| River District new product | Weakest (high basis) | Appraisal-led equity |
| Sunset / Airport workforce SFR | Moderate, unquantified | Steady, single-rent test |
New Brookland and the River District
The mill-village core holds the most interesting split in the city. Columbia Metropolitan Magazine notes the area is designated the New Brookland Historic District and sits on the National Register. The developer’s own history of Brookland traces the neighborhood to 1894 as a residential community for mill workers. That origin points to small older houses and duplexes, though each building’s configuration needs confirming.
Next to that stock sits new product. The Brookland project’s first three phases leased up, and the commercial space reached full occupancy, according to the Post and Courier. The final phase added 52 apartments in a studio, 1BR, and 2BR mix. A single new-build listing shows 2BR/2BA units starting above $2,200, which is a ceiling, not a median.
On the ownership side, a city councilman quoted by the Post and Courier said homes at St. Ann’s Alley, roughly 40 smaller two- and three-bedroom houses, were going for about $300,000. At that basis, the rent-to-price ratio likely sits well below older stock further from the river. That is inference, since River District rents by property type are not published.
The read: River District deals are about appraisal support and equity capture. Older Brookland small buildings are about coverage. An investor holding one of each has a real decision about which to refinance first.
Sunset Boulevard and the Hospital Corridor
Nurses, techs, and other hospital staff are the natural tenant pool around Lexington Medical Center, and the workforce single-family houses nearby are the steadiest, least dramatic holdings in the city. Rent-to-price here is unquantified, so treat any exact coverage claim skeptically.
New apartments show the ceiling. Langley Pointe, a new community on Sunset Boulevard, lists 2BR units from $2,135. That is not workforce pricing. It does mean older houses nearby compete on price against a high-priced new option, which supports demand for them.
Airport, Midlands Tech, and the Lower End
Around the Airport Campus and Fish Hatchery Road, tenants skew toward students and airport-area workers. A listing near Fish Hatchery shows a 2BR from $1,470 with one month free. A listing in adjacent Cayce shows a 2BR/1BR from $1,230, which marks the low end of the workforce range. Both are single listings, not medians. Concessions like that free month are a signal worth pricing into any rent schedule.
Run the Numbers: Two Modeled Scenarios
The two scenarios below use modeled rents and modeled values, not sourced West Columbia figures. Coverage is calculated against full PITIA, meaning taxes and insurance included, and the bands are rounded down.
Scenario one: a fourplex. Say a New Brookland fourplex appraises at a modeled $520,000, with four units at a modeled $1,150 each. Refinance at 75% LTV, and the rents cover the full obligation at around 1.5x including taxes and insurance. The rent-to-value relationship, not the appraisal, carries the file. That is the case for small multifamily: one debt-service test funded by four rents. Terms vary by lender guidelines, property type, leverage, credit profile, and full file review.
Scenario two: a single-family house. Take a house near the hospital corridor at a modeled $262,000 value, roughly Redfin’s median sale price for the city. Use a modeled $1,500 rent, close to RentCafe’s average. At 75% LTV including taxes and insurance, coverage lands just under 1.00x. Exact terms depend on the lender’s guidelines, property type, leverage, and a full review of the borrower’s file.
Just under 1.00x is not the end of the file. Options a lender might review include requesting a lower LTV, which raises coverage. Some programs allow sub-1.00 coverage with compensating factors, and interest-only structures can change the calculation. Any of these is subject to lender guidelines, credit approval, and property review. Nothing here implies a particular structure will be available.
DSCR files in markets like this one typically look a certain way. The strongest ones pair a small multifamily building with a documented lease history, and the weakest lean on an optimistic listing-site rent. Appraisers’ rent schedules land closer to the lower aggregator figures than to new-build asking rents. Getting a current insurance quote and a rent schedule in early tends to prevent surprises late in the file.
Running the numbers on both properties side by side is the fastest way to see which one to pull equity from. Investors can request a quote or call 828-256-2183 to model a specific property.
Appreciation Versus Coverage: What the Sale Data Says
Sale-price momentum supports the appraisal side of a cash-out, but it does not fix a thin rent roll. In West Columbia the appreciation is real, though the sample is small.
Redfin shows a median sale price of $262K, up 7.1% year over year, with homes sitting 49 days on market. Only 19 homes sold in that sample, so it is indicative, not definitive. For context, Redfin’s Columbia page shows a $276K median, up 1.9%. West Columbia sells below the city across the river and has been appreciating faster from that lower base.
For a cash-out investor, a 7.1% price gain on a property held past the seasoning window adds roughly seven points of value to the appraisal. At a 75% LTV ceiling, that widens extractable equity, provided the rents can support the larger balance. It is the classic tension: the appraisal grows, but coverage decides how much of that growth can be pulled out.
This one is a genuine toss-up for River District owners. The equity is there, but the rent-to-value ratio is likely thin. A lower LTV request may deliver a cleaner file than pushing the 75% ceiling.
DSCR vs. conventional financing
Two common ways to finance an investment property in West Columbia, SC. They qualify you differently — here’s how investors weigh them.
Why investors choose it
- Qualifies on the property’s rental income — no personal tax returns, W-2s, or pay stubs needed to document income.
- No personal debt-to-income ceiling to clear, so existing mortgages and obligations don’t cap your borrowing the same way.
- Can be closed in an LLC, keeping the property inside a business entity.
- Built for scaling — not held to the limit on number of financed properties that conventional financing applies.
- Underwriting centers on the deal: generally qualifies when the rent covers the payment, a 1.00x coverage ratio being a common baseline (confirmed in underwriting).
- Designed specifically for investment property, including long-term and, where the program allows, short-term rentals.
Where it’s strong
- Often the lowest ongoing financing cost for a buyer who fully qualifies on personal income — a fit for a first property or a cost-first purchase.
Trade-offs for investors
- Requires full personal income documentation and must fit within a debt-to-income limit — salary, existing debts, and other mortgages all count.
- Typically held in your personal name rather than a business entity.
- Caps how many financed properties you can carry, which can become a ceiling as a portfolio grows.
- Evaluates you as a borrower as much as the property, which usually means more paperwork.
How investors usually choose: a first or single property often optimizes for the lowest financing cost; portfolio builders often optimize for leverage, vesting in an LLC, and scaling past conventional caps. The right answer depends on your goals, the property, and current guidelines — both paths run through select lenders in Lendmire’s wholesale network, with eligibility and terms confirmed in underwriting.
What About All the New Apartments?
New supply is the main coverage risk near the river, and the honest answer is that absorption has been strong so far, but more units are coming. Brookland’s phases leased, and its commercial space reached full occupancy. Those are good signs for older small buildings nearby.
The Post and Courier also reports a planned redevelopment of a vacant shopping center on Sunset Boulevard, with hundreds of apartments and new retail. The article is not recent, and the project’s current status was not verified. If it proceeds, those units could compete for the same tenants along Meeting Street and Sunset.
So stress-test any River District or Sunset-adjacent refinance against softer rents. No official vacancy rate exists to anchor that test, which is another reason to lean on the conservative aggregator figure.
One Columbia-wide investor tool, PropertyDNA, suggests higher cap rates tend to sit in Class B and C neighborhoods, with lower ones in premium, appreciation-led areas. It is a secondary source without a West Columbia breakout, so use it as framing only.
Recycling the Proceeds
Cash-out proceeds are only worth pulling if the next deal covers itself. The math should run forward as well as backward.
If the proceeds fund the next small-building purchase, that purchase gets tested on its own rents. Because units in this market stack at roughly $1,000 to $1,500 each in large-complex data, a two-to-four-unit building generally clears more comfortably than a single house at similar prices. The per-unit figures are a ceiling for older buildings, since the source tracks larger complexes.
Investors weighing conventional financing against this route can review the conventional-vs-DSCR tradeoffs. The broader refinance picture is covered separately, and pulling equity out goes deeper on cash-out structure. For a statewide view, see Lendmire’s South Carolina DSCR investor loans hub.
One reminder applies to every property here. Investors should verify current local rental rules, taxes, and insurance with qualified local professionals. The city’s comprehensive plan notes floodplain areas, which makes flood zone status worth checking on any riverside asset.
Frequently Asked Questions
Does the 6-month seasoning clock apply to properties bought in the River District?
Yes, the clock is measured from title recording regardless of neighborhood. The typical guideline is about 6 months of ownership before a cash-out, though some lenders vary. Newly built or newly renovated River District product may also face appraisal questions about value that rents do not settle. Subject to lender guidelines.
Which West Columbia property type usually produces the highest coverage on a cash-out?
Small multifamily, meaning duplexes, triplexes, and fourplexes in older stock like New Brookland, generally stacks several rents against one debt-service test. Single-family houses near the hospital corridor are steadier but usually land nearer the 1.00 baseline. No published data isolates small-building rents here, so that ranking is analysis, not a sourced ratio.
Can rents from listing sites be used to size the cash-out?
Not directly. A lender’s appraiser produces a rent schedule, and it tends to track the lower aggregator figures, roughly $1,289 to $1,502 for averages here, more than it tracks new-build asking rents. Underwrite from the lower number and treat higher rents as upside.
What happens if a West Columbia rental covers just under 1.00x?
It stays on the table, though the path changes. Lenders may review a lower LTV, a sub-1.00 program with compensating factors, or an interest-only structure. Each depends on credit, reserves, and the property itself, and none is assured.
Is a River District home a good cash-out candidate?
It can be, mainly for equity capture. A home priced near $300,000 likely rents at a lower ratio than older stock further from the river, so coverage will drive how much equity comes out. Test it at a lower LTV first.
Where This Lands
Investors typically pull equity from West Columbia’s River District and reinvest in older small buildings that cover their own debt. That pairing is the market’s cleanest recycling loop.
If you only take one thing from this piece, it’s this: in West Columbia, the appraisal builds in the River District, but the rent roll decides the cash-out, so refinance the fourplex first.
About Lendmire
Lendmire is a non-QM mortgage brokerage (NMLS# 2371349) arranging DSCR investor loans in 41 markets, including Washington, D.C. DSCR eligibility is generally reviewed around property-level rental income rather than personal income, subject to lender and program guidelines, which suits self-employed investors and LLC-owned portfolios. Lendmire was recognized as a 2025 Scotsman Guide Top Mortgage Workplace and a top-ranked workplace in 2026.
Get Started
Ready to find the right loan for you?
In about 30 seconds you can review financing options available for your investment property. No commitment required.
Informational only. Not a Loan Estimate, approval, or commitment to lend. Program availability and eligibility are subject to lender guidelines, credit approval, property review, and underwriting.
References
1. RentCafe, West Columbia rent trends
2. Apartments.com, West Columbia rent market trends
3. U.S. Census Bureau QuickFacts, West Columbia
4. Central SC, top industries and employers
7. Midlands Technical College, Airport Campus
8. University of South Carolina
9. Columbia Metropolitan Magazine, The State of West Columbia
10. estatesinc.com — Brookland Ground Breaking
11. Post and Courier, River District development
13. Redfin, West Columbia housing market
14. Redfin, Columbia housing market
15. a 2025 Scotsman Guide Top Mortgage Workplace
16. Scotsman Guide — Top Workplaces 2026
This article is part of Lendmire’s investment property cash-out refinance program — full qualification details, guidelines, and scenarios live on the program page.
Related reading: Cash Out Refinance Investment Property West Columbia South Carolina · Cash Out Refinance Investment Property Cayce South Carolina · Cash Out Refinance Investment Property Lexington South Carolina
Guides: Investment Property Cash-Out Refinance in South Carolina
Brandon Miller
Founder & CEO, Mortgage Loan Originator, Lendmire LLC
- Mortgage Loan Originator · NMLS# 1129696 · Verify on NMLS Consumer Access
- North Carolina Real Estate Broker · License# 343312 · Verify on NCREC
- North Carolina Insurance Producer · License# 19053198 · Property, Casualty, Life, Health · Verify on NAIC SBS
- Lendmire LLC · Firm NMLS# 2371349 · Verify firm licensure
Important disclosures. Lendmire (NMLS# 2371349) is a licensed mortgage brokerage. Lendmire is not a direct lender, depository institution, or financial advisor. All loan inquiries are subject to lender underwriting; this article does not constitute a commitment to lend. Rates, terms, and program guidelines are subject to change without notice and vary by borrower profile, property type, and state. Information in this article is general in nature and is not financial, legal, or tax advice. Equal Housing Opportunity. NMLS Consumer Access: nmlsconsumeraccess.org.