
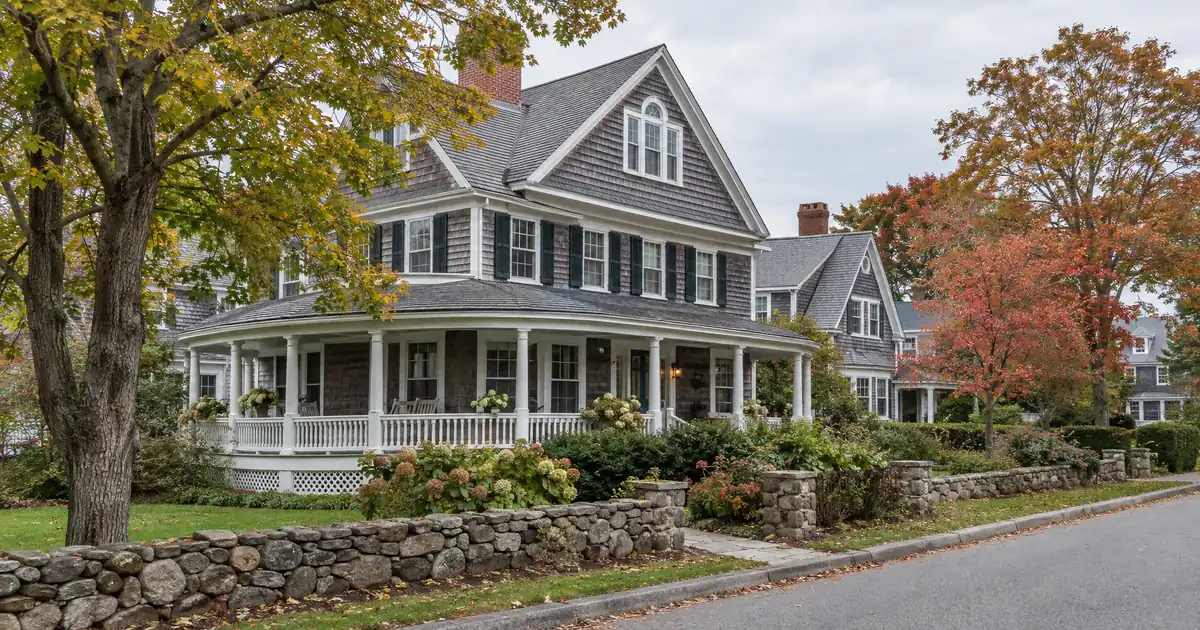
Hyannis is where the Cape’s rental math starts, because it is where the renters live. Per the Town of Barnstable’s housing needs assessment summary, 55% of Hyannis units are renter-occupied, against a 26% rental share across Barnstable as a whole. That gap matters if you own a rental here and are weighing a cash out refinance investment property move. The tenant pool clusters around a small number of anchors, and your coverage ratio depends on whether your property sits inside that pool.
DSCR Cash-Out Calculator
Run the cash-out numbers in Cape Cod, MA
Rate source: Freddie Mac 30-yr average via FRED® — Federal Reserve Bank of St. Louis · effective Sep 24, 2026
Prefilled with starting assumptions — enter your property’s value, balance, taxes, and insurance for a more accurate picture.
Program parameters update from Lendmire’s centralized guideline source. Taxes and insurance are editable estimates.
As of Sep 24, 2026 · General Freddie Mac market benchmark, not a Lendmire loan offer. Property value, balance, taxes, and insurance are editable estimates. Maximum loan-to-value varies by lender, program, property type, and seasoning. Not a Loan Estimate, approval, or commitment to lend. Program availability and eligibility are subject to lender guidelines, credit approval, property review, and underwriting.
The Short Version:
A DSCR cash-out refinance on a Cape Cod, Massachusetts rental is underwritten primarily on the property’s rent measured against its full monthly obligation (principal, interest, taxes, insurance), with the owner’s existing equity setting the ceiling, so the question is less whether you own enough value and more whether year-round rent can carry the new balance.
- Only about 12% of Barnstable County housing units are rented year-round, per the Cape Cod Commission.
- Cash-out tops out at 75% LTV, with about 6 months of seasoning from title recording.
- Barnstable’s $722,000 median sale price pushes modeled single-family coverage below 1.00x.
- Bourne, Mashpee and Yarmouth medians of $588K–$670K sit closest to clearing 1.00x.
- Healthcare employs 27,564 people on the Cape, which anchors year-round tenant demand.
- Every figure here varies by lender and program — guidelines, property type, leverage, and credit profile all apply.
Where the Equity Came From (and Why It May Not Repeat)
Most of the cash-out equity on Cape Cod was created in a single run. Data Cape Cod shows the annual single-family median climbing from $433,000 to $789,500, and it also notes that price increases have slowed since the height of the pandemic. The Cape Cod Commission puts the median at approaching $800,000.
The momentum has flattened. The local realtor association’s first-quarter report says inventory has settled at roughly half of pre-pandemic levels and that price growth has leveled out. Redfin’s Mid Cape page shows prices down 1.5% year over year at a $660K median. (Redfin’s “Mid Cape” boundary may differ from the realtor association’s, so treat the two as directional rather than interchangeable.)
The practical read: underwrite a refinance on today’s appraised value and today’s rent, not on a further climb. An owner who bought before the run-up probably holds plenty of equity. The open question is how much of it the 75% ceiling and the rent can actually release. Equity that exists on paper isn’t the same as proceeds a lender will place against a rental’s coverage ratio.
The 75% Ceiling Meets Thin Rent
Cash-out on a DSCR file caps at 75% LTV, and the property typically needs about 6 months of ownership measured from title recording. Credit tiers generally start at a 620 floor and step up through 660, 680 and 700. Reserves run about 6 months of PITIA, rising to about 9 months for balances above $1,500,000. The minimum coverage benchmark is 1.00x. Lendmire (NMLS# 2371349) structures DSCR scenarios for investors targeting Cape Cod, Massachusetts and places them with wholesale lenders across 41 markets, including D.C. All of these figures are guideline ranges subject to lender guidelines, credit review and property review, not commitments.
Here is where the Cape gets difficult. The ratio is monthly rent divided by the full monthly obligation, taxes and insurance included, and Cape prices are high against Cape rents. Run the numbers on a Barnstable house valued near the $722,000 six-month median reported by the Charles King Group from MLSPIN data. Assume a modeled rent of $3,800 for a three-bedroom house. That is a listing-based average from Rentometer, not a lease comp. At 75% LTV and full PITIA, modeled coverage lands around 0.8x.
That is below the standard benchmark. A lender would review structures that may apply: a sub-1.00 program, which usually means lower leverage and stronger credit; an interest-only structure; or a different property with a lower basis. Whether any of those is available depends on lender guidelines, credit and the property review.
Now a second pass. Say the same modeled $3,800 rent sits on a Bourne, Mashpee or Yarmouth property valued in the $588K–$670K band the same report groups together. Coverage lands near 1.0x at the low end of the band and drifts below it toward the top. It’s a toss-up that depends on the appraiser’s rent schedule, which is why rent-to-value should be settled before anyone talks about proceeds.
The honest takeaway is that the Cape is a basis-sensitive market. Owners with low basis or multi-unit income can get cash out. Owners holding a median-priced single-family house on a long-term lease probably can’t clear 1.00x without reducing the loan amount. If you want the full mechanics, the cash-out qualification details walk through how the ceiling and seasoning interact.
Where the Number Gets Close to 1.00
The Upper Cape gateway and Mid-Cape towns offer the best rent-to-value. The cluster of Bourne, Mashpee and Yarmouth, plus parts of Dennis, sits on the lowest price basis among the Cape’s year-round towns. Rents don’t fall in proportion to prices as you move toward the canal. Chatham and the Outer Cape work the other way.
| Submarket | Price signal | Cash-out fit |
|---|---|---|
| Hyannis / Barnstable | $722,000 median | Deepest renter pool; multi-unit best |
| Bourne / Mashpee / Yarmouth | $588K–$670K medians | Closest to 1.00x coverage |
| Falmouth / Woods Hole | No verified median | Year-round base; underwrite deal by deal |
| Chatham | $1,465,000 median | Appreciation play; weak coverage |
| Outer Cape | No data | Seasonal; poor fit |
Hyannis and Barnstable
Hyannis is the commercial and transit hub. Cape Cod Hospital and the headquarters of Cape Cod Healthcare are here, along with the airport and ferry terminals and regional retail. West Barnstable hosts Cape Cod Community College, which enrolls more than 6,500 credit-seeking students annually but is a commuter campus, so treat it as a soft rental driver at best.
The tenant pool is the deepest on the Cape, and a small multifamily here has the best chance of carrying its own balance. The tradeoff is price. At a modeled $722,000, single-family coverage is thin, and the Barnstable edge belongs to duplexes and two-families, not detached houses.
Bourne, Buzzards Bay and Sagamore
Bourne’s median sat near $348 per square foot, versus about $1,511 in Provincetown, per NNE Real Estate Group. A published report calls Bourne, Sandwich and Pocasset some of the most accessible entry points. Tenant demand comes from Massachusetts Maritime Academy in Buzzards Bay, which enrolls 1,511 undergraduates, and from Joint Base Cape Cod, plus commuters crossing the bridges toward the South Shore and Boston.
This is the likeliest place for a cash-out file to pencil. Owners here with a legal year-round unit and a rent schedule near the listing averages are the ones who may clear 1.00x. The catch is a smaller comp pool, which I cover below.
Yarmouth, Dennis and Falmouth
Yarmouth sits in the same $588K–$670K cluster. Its draw is proximity to Hyannis employers: hospital workers, hospitality and retail. Dennis shares the profile. Falmouth is the second-largest town, with Falmouth Hospital, Woods Hole Oceanographic Institution and the ferry terminal behind its year-round base. No verified Falmouth median turned up in the research, so underwrite deal by deal there rather than from a town-level assumption.
Skip Chatham and the Outer Cape (for Coverage)
Chatham’s $1,465,000 median and $741 per square foot make it a premium, second-home-driven market. Long-term rent doesn’t scale to that price, so coverage is poor. A Chatham owner can have the most equity on the Cape and the least ability to pull it out on a rental-income basis. Provincetown, Wellfleet and Truro are worse for this purpose: the Cape Cod Commission’s census release shows the highest vacancy rates on the Outer Cape, driven by seasonal use. If you hold in either area, a conventional cash-out on personal income may fit better than a rent-driven structure.
The Tenants Behind the Coverage
Healthcare, not tourism, is the Cape’s largest employment sector. The Pioneer Institute counts 27,564 people in healthcare, 21,988 in accommodation and food services, and 18,800 in retail trade. Cape Cod Healthcare calls itself the largest employer on the Cape, with more than 5,300 employees by the system’s own figure as cited there. Woods Hole Oceanographic Institution is the second-largest, with roughly 900 to 1,000 employees.
That mix matters for a long-term rental. Healthcare workers, travel clinicians and allied staff often want 6-to-12-month or year-round leases. Ocean-science staff and graduate students add another stable layer in Falmouth and Woods Hole. Hospitality is the second-largest sector but seasonal, so it shows up as a thinner lease-quality signal.
The demand side carries a ceiling too. The state’s housing snapshot projects no net increase in year-round households. Underwrite for a stable working-age renter base drawn from these employers, not for population growth. It helps that year-round rental stock is scarce: only about 12% of units are rented year-round, and the same snapshot says one in ten homes is a short-term rental while another 25% are set aside for seasonal or occasional use. A compliant long-term unit competes with few peers. (Verify current local rental rules, taxes and insurance with qualified local professionals before you commit.)
Property Type Decides the Math
Duplexes and small multifamily are the best cash-out candidates on the Cape, and they’re scarce. The Cape Cod Commission’s county housing profile says nearly 80% of residential properties are single-family and almost 18% are multifamily. Much of that multifamily is compounds or a house plus a guest house, not classic two-families.
Income stacking is what rescues coverage when the basis is high. Two units dividing a $700,000-range value can clear 1.00x where one unit can’t. No sourced town-level 2-4 unit prices or rents turned up in the research, so the case for a multi-unit refinance has to be built from the appraiser’s rent schedule on the specific property, not from a market average.
Here is how the property types rank for DSCR refinance fit on Cape Cod, from strongest to weakest:
1. Duplexes and small multifamily in Hyannis and Barnstable.
2. Workforce single-family and two-family properties in Yarmouth, Dennis, Bourne and Falmouth.
3. Guest houses and accessory units, where the unit is legal and separately rentable.
Manufactured homes, log homes and barndominiums fall outside the network’s DSCR programs, so that stock doesn’t count even where it exists.
DSCR vs. conventional financing
There are two common ways to finance an investment property in Cape Cod, MA, and they qualify you differently — here’s how investors weigh them.
Why investors choose it
- Qualifies on the property’s rental income — no personal tax returns, W-2s, or pay stubs needed to document income.
- No personal debt-to-income ceiling to clear, so existing mortgages and obligations don’t cap your borrowing the same way.
- Can be closed in an LLC, keeping the property inside a business entity.
- Built for scaling — not held to the limit on number of financed properties that conventional financing applies.
- Underwriting centers on the deal: generally qualifies when the rent covers the payment, a 1.00x coverage ratio being a common baseline (confirmed in underwriting).
- Designed specifically for investment property, including long-term and, where the program allows, short-term rentals.
Where it’s strong
- Often the lowest ongoing financing cost for a buyer who fully qualifies on personal income — a fit for a first property or a cost-first purchase.
Trade-offs for investors
- Requires full personal income documentation and must fit within a debt-to-income limit — salary, existing debts, and other mortgages all count.
- Typically held in your personal name rather than a business entity.
- Caps how many financed properties you can carry, which can become a ceiling as a portfolio grows.
- Evaluates you as a borrower as much as the property, which usually means more paperwork.
How investors usually choose: a first or single property often optimizes for the lowest financing cost; portfolio builders often optimize for leverage, vesting in an LLC, and scaling past conventional caps. The right answer depends on your goals, the property, and current guidelines — both paths run through select lenders in Lendmire’s wholesale network, with eligibility and terms confirmed in underwriting.
Where Cash-Out Files Get Stuck
On Cape files, the friction usually sits with the appraisal, not the borrower’s credit. In markets like this one, the files that move most cleanly from a documentation standpoint tend to carry a signed lease at or near market, a clear unit count and an insurance quote that reflects current coverage. The common sticking point is comparable sales: thin inventory means an appraiser may reach for comps that sit far from the subject, and the rent schedule can come in below the listing averages an owner expects. Lendmire’s deal desk generally sees owners do better when they stress the ratio against a lower rent figure before ordering anything.
That caution lines up with the inventory data. With listings at roughly half of pre-pandemic levels, the sub-$1M segment averages 34.4 median days on market, which tells you buyers are active but not frenzied. Flat-to-slightly-negative Mid Cape pricing argues for conservative LTV assumptions. Don’t count on a value uplift from a light rehab. The 75% ceiling is a ceiling, not a target. Owners who borrow well under it keep room for an appraisal that comes in light.
One structural point: if the property is held in an LLC, vesting can be handled subject to lender program eligibility, and the borrower profile (self-employed, entity-held, several financed properties) is where this route usually beats a conventional cash-out. For a W-2 borrower with one rental and a clean personal tax return, the guide “Where DSCR and Conventional Diverge” is worth reading first. Conventional may carry a lower cost there, and it avoids the coverage test altogether. The flip point tends to arrive around the third or fourth financed property, or sooner if traditional personal-income documentation doesn’t cleanly support the rental income.
What the Proceeds Should Do
The cash-out case is straightforward when proceeds go into another rental where coverage still works. On the Cape that points toward the Bourne-to-Yarmouth corridor and toward small multifamily in Hyannis, where the number gets close to or above 1.00x. It gets harder when proceeds are earmarked for a second Cape single-family purchase at median prices, because that second property starts out below the benchmark and the new debt rides on the first one’s coverage.
The stronger play might be a smaller, lower-basis unit two towns over from where the equity sits, even though exit liquidity is thinner. Investors who want appreciation exposure could argue for keeping the money in a higher-priced town like Chatham. The current market data doesn’t support leaning on that case, since price growth has leveled and the realtor association’s own read is that explosive growth is unlikely without an outside shock.
Out-of-state deployment is a different decision. If the target market’s coverage doesn’t pencil either, the refinance only converts equity into leverage on a weaker position. Both rate-and-term and cash-out refinances are options, and Lendmire’s Massachusetts DSCR loan programs cover the state’s file requirements. If you’d rather test a specific property first, you can talk through the numbers or reach the team at 828-256-2183.
For a quick refresher on the underlying qualification, the guide “What Is a DSCR Loan” covers the ratio in plain terms.
Frequently Asked Questions
How do you qualify for a DSCR cash-out refinance on a Cape Cod rental?
The property’s rent, as set by the appraiser’s rent schedule, is measured against its full monthly obligation: principal, interest, taxes and insurance. A 1.00x baseline is common, though some lenders may review lower scenarios with stronger compensating factors, lower leverage or more reserves. Credit, reserves and seasoning matter too, and eligibility is subject to lender guidelines. On the Cape, the rent schedule is usually the deciding variable because lease comps are thin.
What are the requirements for an investment property loan in Cape Cod, Massachusetts?
For a cash-out, expect a ceiling of 75% LTV, about 6 months of ownership from title recording, a 620 credit floor and about 6 months of PITIA in reserves. Reserves rise to about 9 months for balances above $1,500,000. Loan amounts can run up to $3,000,000 on standard programs. These are guideline ranges, not commitments, and each file is reviewed on its own.
Which Cape Cod towns give a cash-out refinance the best chance of reaching 1.00x?
Bourne, Mashpee and Yarmouth, where medians sit in a $588K–$670K band, are the closest, followed by small multifamily in Hyannis and Barnstable. Single-family at the $722,000 Barnstable median models below 1.00x including taxes and insurance. Chatham and the Outer Cape are poor fits for rent-based coverage.
Does the Cape’s thin inventory make a cash-out appraisal harder? Yes, it can.
With listings at roughly half of pre-pandemic levels, an appraiser may rely on comparable sales that sit farther away or are older than ideal, and the rent schedule can come in below listing averages. Borrowing well under the 75% ceiling gives you a cushion if the value or rent lands light.
What DSCR terms may lenders review for investors in Massachusetts?
Lendmire arranges DSCR investor loans through wholesale lending channels. A key feature is that eligibility is generally reviewed around the property’s rental income rather than personal income documentation, subject to lender guidelines. Terms vary by borrower, property and loan scenario.
For current guidelines and terms, see Lendmire’s DSCR loan programs page.
About Lendmire
Lendmire (NMLS# 2371349) is a DSCR-focused mortgage broker that helps arrange investor financing across 41 markets, including Washington, D.C., through wholesale and investor-lending channels. Lenders generally review DSCR eligibility around the property’s rental income rather than personal income documentation, subject to lender guidelines. That structure tends to suit self-employed investors, LLC operators and portfolios above four financed properties. Scotsman Guide named Lendmire a Top Mortgage Workplace in both 2025 and 2026.
Get Started
Ready to find the right loan for you?
In about 30 seconds you can review financing options available for your investment property. No commitment required.
Informational only. Not a Loan Estimate, approval, or commitment to lend. Program availability and eligibility are subject to lender guidelines, credit approval, property review, and underwriting.
References
1. Cape Cod Commission: Incentivizing Year-Round Rental Housing
2. Data Cape Cod: Real Estate Trends
3. cciaor.com — First Quarter Cape Cod Market Report Median Priced Homes in High Demand
5. Rentometer
7. Mass.gov: Cape Cod Housing Snapshot
8. 2025
9. 2026
This article is part of Lendmire’s investment property cash-out refinance program — full qualification details, guidelines, and scenarios live on the program page.
Related reading: Luxury Rental DSCR Loans In New Jersey · Jersey Shore Vacation Rental Loans: DSCR Financing In Ocean City, Cape May And Long Beach Island · DSCR Cash-out Refinance In New Jersey: Pulling Equity From A Rental
Guides: Investment Property Cash-Out Refinance in Massachusetts
Brandon Miller
Founder & CEO, Mortgage Loan Originator, Lendmire LLC
- Mortgage Loan Originator · NMLS# 1129696 · Verify on NMLS Consumer Access
- North Carolina Real Estate Broker · License# 343312 · Verify on NCREC
- North Carolina Insurance Producer · License# 19053198 · Property, Casualty, Life, Health · Verify on NAIC SBS
- Lendmire LLC · Firm NMLS# 2371349 · Verify firm licensure
Required disclosures. Lendmire (NMLS# 2371349) operates as a licensed mortgage broker, not a direct lender or depository. The discussion in this article is general in nature and should not be relied upon as financial, legal, or tax advice — every investment scenario is unique and should be reviewed by a qualified professional. Any loan inquiry is subject to lender underwriting, and this article is not a commitment to lend or a guarantee of approval. Mortgage rates, loan terms, and program guidelines vary by borrower, property, and state, and may change without notice. Equal Housing Opportunity. Verify licensure at NMLS Consumer Access.