
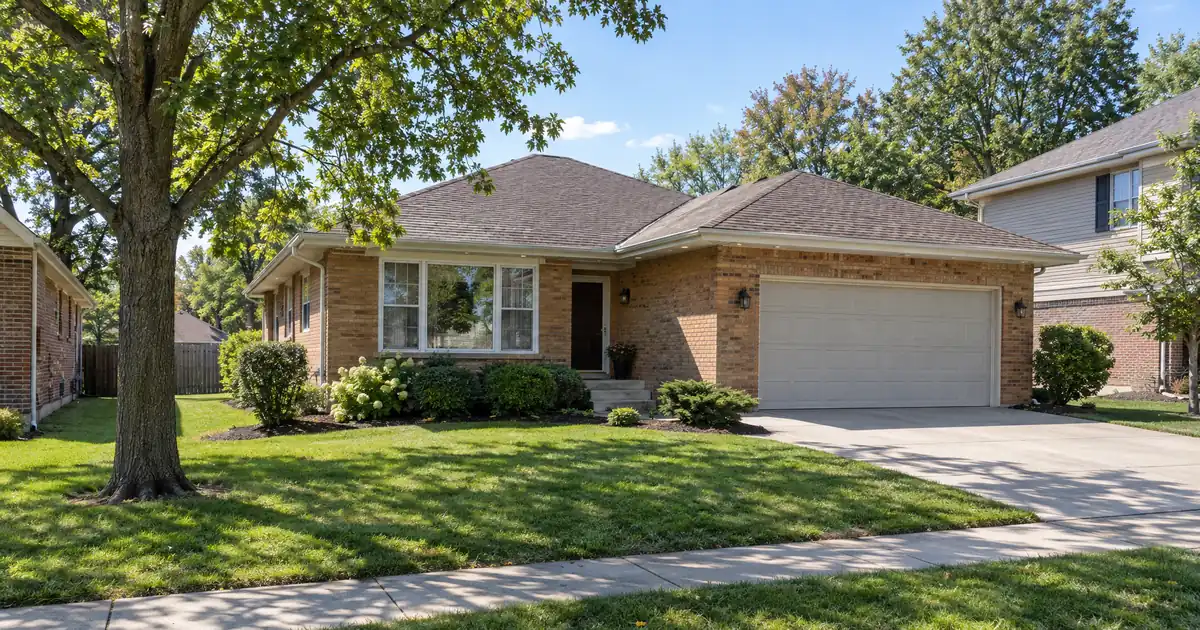
An out-of-state investor scrolling Orland Park listings sees a three-bedroom rental average of $3,077 a month on Rentometer and thinks the cash-out math must be easy. What that investor usually misses is the market’s shape. Per RentCafe, 86 percent of Orland Park households own their homes, so the rental pool is thin, the comparable rents are few, and the multi-unit inventory that makes equity recycling easy elsewhere barely exists here. Lendmire (NMLS# 2371349), a DSCR-focused mortgage broker, sees this pattern often in mature inner-ring suburbs: the equity is real, but the cash-out is constrained by coverage, not by value.
DSCR Cash-Out Calculator
Run the cash-out numbers in Orland Park, IL
Rate source: Freddie Mac 30-yr average via FRED® — Federal Reserve Bank of St. Louis · effective Sep 24, 2026
Prefilled with starting assumptions — enter your property’s value, balance, taxes, and insurance for a more accurate picture.
Program parameters update from Lendmire’s centralized guideline source. Taxes and insurance are editable estimates.
As of Sep 24, 2026 · General Freddie Mac market benchmark, not a Lendmire loan offer. Property value, balance, taxes, and insurance are editable estimates. Maximum loan-to-value varies by lender, program, property type, and seasoning. Not a Loan Estimate, approval, or commitment to lend. Program availability and eligibility are subject to lender guidelines, credit approval, property review, and underwriting.
The Short Version:
Cash-out refinancing on an Orland Park, Illinois rental is underwritten primarily on the property’s rental income measured against its full monthly obligation, so the size of the check depends on what Zillow’s roughly $397,472 average home value can carry in rent, not on how much equity has accumulated.
- Cash-out leverage is capped at 75 percent LTV, and coverage thins as you approach it.
- Ownership seasoning of about 6 months, measured from title recording, comes before a cash-out.
- The two ZIP codes, 60462 and 60467, behave like different rental markets.
- Multi-unit inventory is scarce, so proceeds often go to single-family or condo acquisitions.
- Every eligibility term is subject to lender guidelines, credit review, and property review.
Orland Park Market Snapshot
A quick read on the Orland Park investor landscape — figures come from the cited sources below. Confirm current property-level numbers before underwriting.
| Metric | Detail |
|---|---|
| Home prices | $385K median (Redfin Housing Market) |
| Typical rents | $2,561 avg (RentCafe) |
| Recent appreciation | +4.8% yoy (Zillow Home Values) |
| Population | Population 58,703 (2020) (Wikipedia – Orland Park) |
| Employment | 2,800 employees (Chicago Sun-Times, Palos) |
| Vacancy | 4.49% (zip-codes.com 60462) |
What Out-of-State Investors Miss About Orland Park
Orland Park is a built-out, owner-occupied suburb, and that shapes everything about a cash-out here. Population sits near 57,916 per Census Reporter’s ACS profile, and the Neilsberg analysis of Census estimates shows a 2.51 percent decline between 2020 and 2023. Nobody is underwriting population-growth appreciation here. The thesis is rent durability on a stable base.
That is a skeptic’s starting point, and it cuts both ways. Stability means vacancy stays low and rent comps hold. It also means you won’t get the double-digit price spikes that bail out a thin coverage ratio in growth markets. Zillow puts appreciation at 4.8 percent over the past year, and Redfin shows a median sale price near $385,000, up 5.8 percent. The two sources differ on methodology, which is why this article works with a range of roughly $360,000 to $435,000 across sources rather than one precise number.
Mid-single-digit appreciation is fine. But an investor counting on it to refill equity quickly after a cash-out should temper the plan. A refinance today spends equity you built through paydown and past appreciation, and the next tranche arrives slowly.
Rent data also disagrees by source. Zumper reports averages near $2,990 and Apartments.com near $2,061 (apartment-heavy, so lower). Rentometer’s three-bedroom figure fits single-family rentals best, which is what most cash-out candidates here actually are. Treat the source you use for coverage math as a decision, not a default.
Two ZIP Codes, Two Different Cash-Out Profiles
60462 is the better DSCR entry point for most investors; 60467 is more of an appreciation holding. Data from zip-codes.com for 60462 shows a median home value of $348,900, median gross rent of $1,432, renters at 17.05 percent of occupied housing, and vacancy of 4.49 percent. For 60467, the same source shows $411,700, $2,149 rent, 6.59 percent renters, and 3.59 percent vacancy.
Read those together. Renters are nearly three times as prevalent in 60462, which means more rental comps and an easier property review when a lender looks at market rent. Home values there are also up 21.44 percent since 2011, so it isn’t purely a cash-flow submarket. It has picked up appreciation as well. In 60467, values are up about 16 percent since 2019, on a much smaller rental base. A cash-out on a 60467 home can pencil well on paper, but the appraiser has fewer nearby leases to point to. Thin comps make rent conclusions harder to defend.
Here’s the catch on the ACS rent figures. Those median gross rents cover all rental units, including older leases, and they trail current listing rents by a wide margin. A three-bedroom house asking near the Rentometer average will look much stronger than the ZIP median. Lenders generally look at market rent for the specific property, so listing-level evidence matters more than the aggregate. Going the other way, don’t assume a $3,000-plus asking rent will hold if the nearest comparable leases are far below it.
Downtown Orland Park and the 143rd Street Corridor
The downtown corridor has the strongest appraisal story in the village, and the most to prove on rent. Redfin’s downtown neighborhood page shows a median sale price of $366,000, up 12.7 percent year over year, at $206 per square foot. That is faster appreciation than the citywide figures. The village’s Main Street Triangle mixed-use project at 143rd Street and LaGrange Road is adding restaurants, retail, and entertainment across 140,000 square feet, according to the Wikipedia entry for Orland Park, with completion still ahead.
Commuter demand backs the corridor. Metra’s SouthWest Service data on Wikipedia’s 143rd Street station page shows 591 average weekday boardings, ranking 86th of 236 non-downtown stations. The 153rd Street station shows 544. The 179th Street station shows just 208. Rentals near the two northern stations should hold Chicago-bound tenant demand better than rentals at the far south end of the village.
Two cautions. First, a 12.7 percent annual gain in one neighborhood is a short-window number, and it rewards those who already own there. An investor buying in on that momentum is taking a different bet than an investor cashing out of it. Second, redevelopment stories are catalysts, not guarantees. A project that hasn’t finished is not yet a rent driver.
Run the Numbers: A Modeled Three-Bedroom Cash-Out
At the 75 percent LTV ceiling, coverage on a typical Orland Park three-bedroom lands just above break-even; at lower leverage it improves meaningfully. Run the numbers this way, using modeled assumptions rather than sourced market facts: a single-family rental valued at $400,000, a modeled rent of $3,000 (near the Rentometer three-bedroom average of $3,077 a month for houses), and a full obligation that includes principal, interest, taxes, and insurance at Illinois-typical loads. The coverage ratio is monthly rent divided by that full monthly obligation. The guide “What Is a DSCR Loan” is worth a read if the mechanics are new.
Under those assumptions, a cash-out at 75 percent LTV produces coverage of roughly 1.0 to 1.1x including taxes and insurance. Drop leverage to 65 percent and the number moves into the 1.1 to 1.2x range. The standard baseline in most DSCR programs is 1.00x, and this property clears it, but not by much. Rounding down here is deliberate. A rent that softens or an insurance renewal that jumps could erase the cushion.
That tension defines the decision. Pulling the maximum cash-out gives you more capital and a tighter file. Stopping at 65 or 70 percent leaves less to deploy but gives you a loan that survives a bad renewal year. If the goal is to fund a single next acquisition, the smaller draw is often the better structure.
Now a weaker case. Say a two-bedroom townhome valued at $400,000 carries market rent near the Rentometer two-bedroom average of $2,176, plus HOA dues in the obligation. That lands well below 1.00x on long-term rent alone. Options a lender may review include a sub-1.00 program with reduced leverage and stronger credit, an interest-only structure, or a lower loan amount that brings the ratio up. Eligibility review depends on lender guidelines, credit approval, and property review. And if you are reaching for sub-1.00 because nothing in your portfolio covers at standard terms, that’s a signal to reexamine what you hold, not the loan type.
DSCR files in markets like this one typically come in with adequate value but narrow coverage. The equity is there, the ratio is the constraint, and the file often improves by trimming the loan amount rather than by hunting for a higher appraisal. Investors who bring lease evidence for comparable nearby rentals, plus a current insurance quote, tend to avoid the surprises that come from stale assumptions. Reserves matter as well: programs commonly look for about 6 months of PITIA in reserves, which can eat into the proceeds you plan to redeploy.
What’s the Catch on Seasoning and the 75 Percent Cap?
The catch is that the cap and the seasoning clock apply to you regardless of how much value you think you have. Programs commonly require about 6 months of ownership measured from title recording before a cash-out, which is shorter than the 12 months many conventional paths ask for. The maximum cash-out LTV is 75 percent, and credit tiers on the network generally run from a 620 floor upward to 660, 680, and 700, with pricing and leverage improving at higher tiers. Loan amounts up to $3,000,000 are possible on standard programs, though nothing in Orland Park’s price range gets near that. All of this is subject to lender guidelines and varies by borrower, property, and loan scenario.
Consider an investor who bought a rental in 60462 and hit the 6-month mark. The temptation is to refinance immediately against a fresh appraisal. Two questions should come first. Did the appraisal actually support a value above the purchase price, or does the loan-to-value math only work if the appraiser agrees with your assumptions? And after paying off the existing loan, is the leftover cash worth the new obligation? At 75 percent of a modest value gain, the net proceeds can be smaller than the headline suggests, especially if the original purchase used high leverage.
Equity available is never a guaranteed cash figure. It depends on rent used for lender review, PITIA, reserves, and the 75 percent ceiling all at once. The equity recycle pathway walks through how those variables interact, and Lendmire’s refi programs cover the rate-and-term alternative for investors who don’t need the cash. The Illinois DSCR overview at Lendmire is worth a look before you commit to a structure.
Where the Proceeds Go (and Why Multi-Unit Is a Long Hunt)
Investors pulling equity in Orland Park should expect to redeploy into single-family, condos, or townhomes, because duplexes and fourplexes barely turn over. A monthly Redfin snapshot of Orland Park condos and townhomes showed just one multi-family property against 49 condos and 81 townhouses. That is essentially no inventory for an income-stacking strategy. The Orland Crossing area has the most apartments, but that is a renter-heavy apartment cluster, not a pool of small buildings for sale.
So the recycle thesis looks different here than in a city with legacy two-flats. Consider an investor who pulls equity from one 60462 house and targets a second single-family rental in the same ZIP. That works if the target rents near the local average and the coverage clears at the leverage planned. It gets shakier if the proceeds go toward a condo where HOA dues raise the monthly obligation and drag coverage below what a detached home would show.
The stronger play might be spreading proceeds into adjacent Cook County suburbs where small multifamily is more available, though that means comparing different submarkets, different tax profiles, and different tenant bases. It’s a genuine trade-off: the familiar market with thin product, or a less familiar one with better unit-stacking. Investors with more than four financed properties will find DSCR is essentially the only working lane either way, since conventional limits run out. For a single rental owned personally by a high-W-2 borrower, how the two loan types differ matters, and a conventional cash-out may cost less if the seasoning and documentation fit.
Demand Anchors: Healthcare and Commuters, Not Manufacturing
Long-term tenant demand here rests on healthcare, retail, and commuter rail, and the old employer lists overstate manufacturing. The village’s older financial report ranked school districts, Jewel-Osco, and department stores at the top, but several of those retailers have since closed, so that list is directional at best. Panduit is a good example of the drift. It is headquartered in Tinley Park with about 4,400 employees per LeadIQ, and it keeps only an office in Orland Park. Modeling tenant demand around Panduit would overstate local anchoring.
Healthcare is the sturdier anchor. Northwestern Medicine’s Palos location followed the Palos Health merger, and the Chicago Sun-Times reported about 2,800 employees across the system’s two facilities, including a south campus in Orland Park and a 425-bed hospital in Palos Heights. The Orland Park footprint is largely outpatient and surgical rather than a flagship inpatient campus, which makes it a steady but not dramatic source of shift-work renters. Marquette Bank and the Orland Fire Protection District round out the named local employers.
Skeptics should notice what’s absent: a single dominant employer, a university, or a large new residential pipeline. Vacancy is low, per the ZIP-level figures above (3.59 percent and 4.49 percent), and that de-risks rent durability. It doesn’t create upside. This is a hold-and-collect market.
One Thing a Local Appraiser Would Tell You
Orland Park doesn’t reward a cash-out built on the highest number an appraisal might produce. Homes here sell on condition, location relative to the 143rd Street corridor, and the handful of comparable leases nearby, so the investor who stops at a moderate loan-to-value with a documented rent and a fresh insurance quote will usually get a cleaner file than the one who pushes to the cap and hopes the comps cooperate.
DSCR vs. conventional financing
Two common ways to finance an investment property in Orland Park, IL. They qualify you differently — here’s how investors weigh them.
Why investors choose it
- Qualifies on the property’s rental income — no personal tax returns, W-2s, or pay stubs needed to document income.
- No personal debt-to-income ceiling to clear, so existing mortgages and obligations don’t cap your borrowing the same way.
- Can be closed in an LLC, keeping the property inside a business entity.
- Built for scaling — not held to the limit on number of financed properties that conventional financing applies.
- Underwriting centers on the deal: generally qualifies when the rent covers the payment, a 1.00x coverage ratio being a common baseline (confirmed in underwriting).
- Designed specifically for investment property, including long-term and, where the program allows, short-term rentals.
Where it’s strong
- Often the lowest ongoing financing cost for a buyer who fully qualifies on personal income — a fit for a first property or a cost-first purchase.
Trade-offs for investors
- Requires full personal income documentation and must fit within a debt-to-income limit — salary, existing debts, and other mortgages all count.
- Typically held in your personal name rather than a business entity.
- Caps how many financed properties you can carry, which can become a ceiling as a portfolio grows.
- Evaluates you as a borrower as much as the property, which usually means more paperwork.
How investors usually choose: a first or single property often optimizes for the lowest financing cost; portfolio builders often optimize for leverage, vesting in an LLC, and scaling past conventional caps. The right answer depends on your goals, the property, and current guidelines — both paths run through select lenders in Lendmire’s wholesale network, with eligibility and terms confirmed in underwriting.
Frequently Asked Questions
Can I do a cash-out refinance on an Orland Park rental I bought only a few months ago?
Generally only after about 6 months of ownership measured from title recording, which is shorter than the 12 months many conventional paths require. Lenders also review the appraised value against your purchase price, so a recent bargain purchase may support more equity than one bought at market. Eligibility remains subject to lender guidelines and property review.
Does Orland Park’s low renter share hurt the appraisal on a cash-out?
It can, mainly in 60467, where renters make up only 6.59 percent of occupied housing and comparable leases are harder to find. In 60462, at 17.05 percent, rental comps are easier to gather. Bringing lease evidence for similar nearby homes helps the rent conclusion in either ZIP.
What coverage should I expect on a typical three-bedroom here?
On modeled assumptions, including taxes and insurance, coverage lands roughly 1.0 to 1.1x at the 75 percent LTV ceiling and improves at lower leverage. Actual results depend on the specific rent, value, and insurance quote. Getting a lender’s read on your numbers before you commit is more reliable than any modeled figure.
Is a condo or townhome a good candidate for a cash-out here?
It can qualify, but HOA dues add to the monthly obligation and lower coverage relative to a detached home at the same rent. With 49 condos and 81 townhouses showing in a monthly Redfin snapshot, comps are available, but check the ratio with dues included before assuming it clears 1.00x. Some property types fall outside these programs entirely, including manufactured homes, log homes, and barndominiums.
Should I use proceeds for another Orland Park property or look elsewhere?
It depends on coverage. Single-family in 60462 can work at standard leverage, but multi-unit inventory in the village is nearly nonexistent, so investors seeking unit-stacking often look at adjacent suburbs. Comparing the coverage at your planned leverage in each submarket is a better guide than familiarity alone. Investors can reach Lendmire at 828-256-2183 to talk through the structure, or see how the math pencils on a specific property. Local taxes, insurance, and rental rules should be confirmed with qualified local professionals.
For current guidelines and terms, see Lendmire’s DSCR loan programs page.
About Lendmire
Lendmire (NMLS# 2371349) is a DSCR-focused mortgage broker that helps arrange investor financing across 41 markets, including Washington, D.C., through wholesale and investor-lending channels. DSCR eligibility is generally reviewed by the lender on the property’s rental income rather than personal income documentation, subject to lender guidelines, which works for self-employed investors, LLC operators, and portfolios above four financed properties. Scotsman Guide named Lendmire a Top Mortgage Workplace in both 2025 and 2026.
Get Started
Ready to find the right loan for you?
In about 30 seconds you can review financing options available for your investment property. No commitment required.
Informational only. Not a Loan Estimate, approval, or commitment to lend. Program availability and eligibility are subject to lender guidelines, credit approval, property review, and underwriting.
References
2. RentCafe, Orland Park rent trends
3. Zillow Home Values, Orland Park
5. Wikipedia entry for Orland Park
6. Chicago Sun-Times, Palos Health and Northwestern Medicine merger
7. Zip-Codes.com — Zip Code Zip Code
8. Census Reporter, Orland Park profile
9. Zip-Codes.com — Zip Code Zip Code
10. Redfin, Downtown Orland Park
11. Wikipedia’s 143rd Street station page
12. Wikipedia — 153rd Street Orland Park Station
13. Wikipedia — 179th Street Orland Park Station
14. Orland Park condos and townhomes
15. LeadIQ
16. Northwestern Medicine, Palos
17. 2025
18. 2026
This article is part of Lendmire’s investment property cash-out refinance program — full qualification details, guidelines, and scenarios live on the program page.
Related reading: Luxury Rental DSCR Loans In New Jersey · Jersey Shore Vacation Rental Loans: DSCR Financing In Ocean City, Cape May And Long Beach Island · DSCR Cash-out Refinance In New Jersey: Pulling Equity From A Rental
Guides: Investment Property Cash-Out Refinance in Orland Park, IL · Investment Property Cash-Out Refinance in Illinois
Brandon Miller
Founder & CEO, Mortgage Loan Originator, Lendmire LLC
- Mortgage Loan Originator · NMLS# 1129696 · Verify on NMLS Consumer Access
- North Carolina Real Estate Broker · License# 343312 · Verify on NCREC
- North Carolina Insurance Producer · License# 19053198 · Property, Casualty, Life, Health · Verify on NAIC SBS
- Lendmire LLC · Firm NMLS# 2371349 · Verify firm licensure
Disclosures. The information presented in this article is general market commentary, not financial, legal, or tax advice. Lendmire is a mortgage brokerage (NMLS# 2371349) — not a direct lender or depository institution — and loan placement is subject to lender underwriting. Nothing in this content represents a commitment to lend. Loan terms, pricing, and program availability vary based on borrower qualifications, property characteristics, and state of subject property, and are subject to change at any time. Lendmire complies with Equal Housing Opportunity requirements. Consumer access: nmlsconsumeraccess.org.