
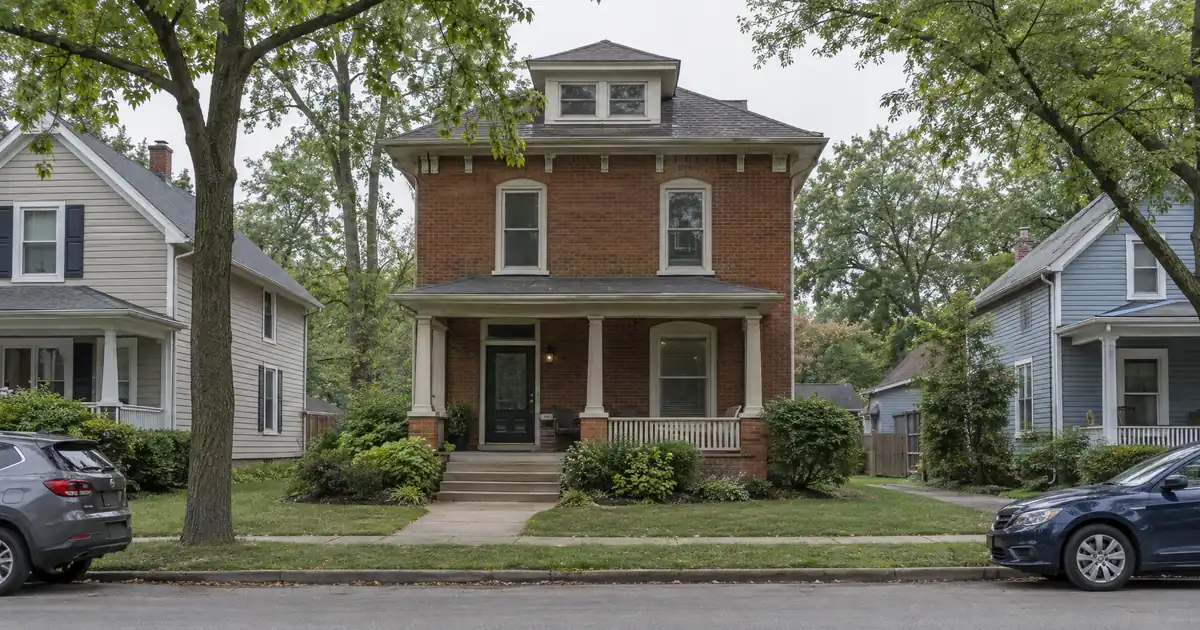
Picture an investor holding a three-bedroom house near the Ronald Reagan Parkway corridor, bought at $313K and leased out. The portals say the property is worth more now, and the investor wants that equity working on the next deal. Then three data sources return three different values, and the rent comps split just as widely. The equity pull comes down to which number the appraiser lands on and which rent figure the lender accepts.
DSCR Cash-Out Calculator
Run the cash-out numbers in Brownsburg, IN
Rate source: Freddie Mac 30-yr average via FRED® — Federal Reserve Bank of St. Louis · effective Sep 24, 2026
Prefilled with starting assumptions — enter your property’s value, balance, taxes, and insurance for a more accurate picture.
Program parameters update from Lendmire’s centralized guideline source. Taxes and insurance are editable estimates.
As of Sep 24, 2026 · General Freddie Mac market benchmark, not a Lendmire loan offer. Property value, balance, taxes, and insurance are editable estimates. Maximum loan-to-value varies by lender, program, property type, and seasoning. Not a Loan Estimate, approval, or commitment to lend. Program availability and eligibility are subject to lender guidelines, credit approval, property review, and underwriting.
The Quick Read:
A cash-out refinance on a Brownsburg, Indiana rental is underwritten primarily on the property’s rental income measured against its full monthly obligation, with leverage capped by the appraised value, so a conservative value and a defensible house-specific rent decide how much equity comes out.
- The cash-out ceiling is 75 percent LTV, after roughly six months of ownership from title recording.
- Renters occupy only 27 percent of households, so lease comps are scarce.
- Value sources span from $310,250 to $395,000, so appraiser variance is the main risk.
- Full-PITIA coverage on a typical three-bedroom runs near 1.00 at maximum leverage.
Brownsburg Market Snapshot
A quick read on the Brownsburg investor landscape — figures come from the cited sources below. Confirm current property-level numbers before underwriting.
| Metric | Detail |
|---|---|
| Home prices | The median home value is $244,256 (Town of Brownsburg, About). |
| Employment | 400+ jobs (Town of Brownsburg, Home) |
The Parkway Corridor Is the Strongest Submarket (With a Catch)
The Ronald Reagan Parkway and I-74 corridor is where Brownsburg’s demand story is concentrated. It holds Brownsburg Hospital, the newest apartment communities, the recently opened first phase of the parkway extension, and the site for the biggest private investment in town history. For an investor already holding a house nearby, it is the most defensible location to refinance.
The anchor is Labcorp. Labcorp’s announcement describes a 50-acre campus with more than 500,000 square feet of lab and production space. Per the Brownsburg Sentinel, 1,776 jobs will relocate at an average of $40.71 an hour, and more than 300 new jobs are expected at $45.90. Investment runs about $435 million.
Read that carefully. The 1,776 jobs are moving from a site roughly six miles away, so they are relocating rather than arriving. The net-new number is the 300-plus. Construction hasn’t started on the reported schedule, and completion is years out. This is a slow tailwind for mid-market rentals, not a rent spike you can underwrite today. Anyone building a refinance thesis on “Labcorp will lift rents” is pricing a future that hasn’t been built.
The corridor also has the most new apartment product, and that’s the catch. Rent.com shows communities such as Bailey Park, Redwood Brownsburg, Legacy Park, and Dublin Glen listing two-bedrooms from about $1,817 to $1,871. Listings in the same data advertise concessions like “1 Month Free” and “$1,000 Off.” An older single-family rental competes against that supply. Underwrite lease-up time, not an assumption of zero vacancy.
What the Rent Data Actually Says
Brownsburg rent figures disagree enough that no single number should anchor a file. The spread runs from about $1,460 to $1,923 depending on the source, and the methodology behind each is different.
| Source | Median or average rent |
|---|---|
| RentCafe (50+ unit buildings) | $1,654 average |
| Zumper | $1,923 median |
| Redfin | $1,460 median |
| Niche | $1,486 median |
RentCafe tracks larger apartment buildings only, which is why its three-bedroom figure ($2,087) reads high for an older house. Zumper blends all bedroom counts and property types. Redfin and Niche sit lower. Nobody should call this market’s rent growth “rising” with a straight face either. RentCafe shows 10.23 percent, Zumper shows 24 percent, and other aggregators show flat or negative readings. Treat trend claims as noise and underwrite the lease in hand.
The tenant mix helps narrow the target. Point2Homes puts 44.67 percent of rentals in the $1,500 to $2,000 band, and 47 percent of its 1,420 rentals are two-bedrooms. That points toward two- and three-bedroom houses at mid-market rents, not luxury product and not studios. Four-bedrooms are only 4 percent of the pool (60 units), so an appraiser’s market-rent estimate on a large house may come in below the asking rent. Skip the assumption that a big house means big rent here. The comp pool is too thin to defend it.
Where the Coverage Math Lands
Brownsburg cash-out files pencil near 1.00 at full leverage, and they improve only when the investor trims the loan. That is the honest read, and it is more useful than a headline rent number.
Run the numbers on a house appraising near Zillow’s $362,536 average value. Assume a modeled rent of $2,087, borrowed from the RentCafe three-bedroom figure, which is a modeling input and not a comp. At 75 percent LTV, full PITIA including taxes and insurance puts coverage just under 1.00. Drop leverage to about 65 percent and the ratio moves into the low-1.1 range. At 60 percent it moves a bit higher, around 1.15 to 1.2. These are modeled bands, not quotes, and they round down on purpose.
Here’s the twist: a lower appraisal can help coverage while hurting proceeds. Value the same house at the Redfin median of $313K and run 75 percent LTV against the same rent. Coverage clears 1.00 comfortably, around 1.1, because the loan is smaller. But the equity coming out shrinks too. The value you want for proceeds is the opposite of the value that helps the ratio. Honestly, this one’s a genuine toss-up: most investors in this price band end up choosing a leverage level below the cap just to make the file breathe.
Most standard DSCR programs are built around a 1.00 benchmark because rent covers the full payment at that level. Some lenders review scenarios under 1.00, but those files typically need stronger credit, lower leverage, more reserves, or a different structure, and approval stays subject to lender guidelines, credit review, and the appraisal. If a house you own models at 0.95, the realistic paths are a lower loan amount, a sub-1.00 program in the network, or an interest-only structure to lift the ratio. Each one is a lender decision, not a given. For the mechanics behind these ratios, see the DSCR qualification mechanics.
Appraisal Risk: Four Sources, Four Answers
Brownsburg value data is too inconsistent to treat as settled. Zillow shows $362,536, up 1.3 percent over the past year. Redfin shows a $313K median sale price, down 10.7 percent, with days on market rising to 29 from 20 on only 32 sales in the month. Movoto reports a $395,000 median for the same month, and U.S. News shows $310,250.
That is a gap of roughly $85,000 between the high and low reading on what is essentially the same market. A 32-sale month is thin evidence for any of them. For a cash-out borrower, this is the central problem. Appreciation isn’t doing the work here; Zillow’s 1.3 percent is barely a drift and Redfin’s number is negative. Proceeds will come from a low purchase basis, a value-add, or rehab that moved the house into a better comp set. Market drift won’t supply them.
The practical read: model leverage off the conservative end of that range, and expect the appraiser to pick comps from the new-build side if your house sits next to a recent subdivision. If the file only works at the Movoto number, it doesn’t work.
A Pattern Brokers See in Owner-Dominated Suburbs
Working DSCR brokers see a recurring pattern in suburbs where renters are a small minority: investors quote asking rents from apartment aggregators, the lender’s appraisal returns a lower market-rent estimate from a thin house-lease comp set, and the coverage ratio lands one notch lower than the borrower expected. Files that survive this usually brought three signed single-family leases from the same neighborhood and a leverage target below the cap. In a market where only about 27 percent of households rent, the comp pool is the constraint, so bring it with you.
Why Brownsburg Is Not a Small-Multifamily Play
A 2-4 unit stacking strategy isn’t repeatable inside Brownsburg. Redfin’s multi-family listings showed one multi-family property, 20 condos, and 6 townhouses for sale in a recent month (the page carries stale population data, so treat the count as a rough snapshot). No reliable local source on duplex or fourplex rents turned up, so none are claimed here. Brownsburg is a single-family, owner-occupied suburb. Coverage has to work on one lease.
Investors who want stacked income typically look outside town, at Indianapolis west-side product or nearby Avon and Plainfield inventory. Equity pulled from a Brownsburg house can fund those purchases. That is the real use of this refinance: a seasoned single-family asset becomes down-payment capital elsewhere, rather than a cash machine in place. For the broader mechanics of redeploying proceeds, the investor refinance breakdown covers the sequencing.
Downtown, the Raceway Side, and South Green Street
Downtown and Main Street are the historic core, and the town publishes a Main Street Vision Plan as part of its economic development effort. No reliable price or rent data exists for the core, so call it a qualitative story. Older housing near Main Street may sit under a different appraisal comp set than the parkway corridor, which makes the value conversation harder, not easier.
The US-136 and Lucas Oil Indianapolis Raceway Park area has an identity the rest of Indiana lacks. Visit Hendricks County describes the NHRA-owned track as having made Brownsburg a “motorsports haven” for race teams and manufacturers, and it hosts the NHRA U.S. Nationals every Labor Day weekend. That suggests a race-industry workforce and a seasonal event pulse. No rental data supports a premium, so don’t underwrite one.
The South Green Street and Avon border is where Hendricks Regional Health runs its Green Street medical building for the south side of town and northwest Avon. Medical demand is real but small in Brownsburg itself. The Town’s healthcare page describes the local hospital as a six-bed facility, while IU Health West in Avon is a 125-bed acute care hospital. Per Data USA, health care and social assistance is the top resident employment sector at 2,625 people, but many of those jobs sit outside town. Eagle Creek shows a $1,665 median rent on Redfin’s page, but the page is thin and dated. One data point is not a submarket.
Employers and Demand: Real but Diversified Beyond One Name
The employment base is wider than the Labcorp headline. The Town of Brownsburg names Brunswick, a Fortune 500 company, along with FGF Brands and Orano Med among major employers. A separate town page lists Maplehurst Bakeries and LAPP USA instead, so the list rotates. The county’s major-employer list includes HomeGoods Distribution Center and O’Reilly Auto Parts Distribution, both in Brownsburg. No reliable headcounts exist for these, so none are quoted.
The Hendricks County Economic Development Partnership points to the county’s position next to Indianapolis International Airport and the nation’s second-largest FedEx hub, with a workforce experienced in motorsports, medical devices, and food production. The town’s home page reports a HarperCollins logistics facility, expected to open a few years out, creating over 400 jobs. Add resident incomes: U.S. News puts median household income at $111,622. Per the Census Bureau, population reached an estimated 33,430, up 15.4 percent from the 2020 count of 28,973.
Growth and incomes are real. They support long-term tenant demand for mid-market houses. But they also feed the owner-heavy tenure mix: many of those households buy. Brownsburg has no universities or community colleges, so don’t model it as a student market.
Loan Parameters That Matter Here
Three parameters shape a Brownsburg cash-out file, and all are typical guideline figures subject to lender program requirements. First, the cash-out ceiling is 75 percent LTV, a hard cap, and it applies to the appraised value, not the purchase price. Second, seasoning runs about six months of ownership, measured from title recording, so a recent cash purchase can usually be refinanced soon after that mark. Third, reserves typically run about six months of PITIA. Credit tiers generally start at a 620 floor and step up through 660, 680, and 700, with better tiers supporting stronger structures.
Equity available is never a guaranteed figure. It depends on rent used for lender review, the full obligation, reserves, and that 75 percent ceiling. Loan amounts on standard programs can go up to $3,000,000, and most Brownsburg balances will sit far below that, so smaller loans route through select lenders in the network. LLC-titled holdings are common for these files, subject to lender program eligibility. For the full cash-out workflow, DSCR cash-out refi mechanics walks through it, and the guide “Where DSCR and Conventional Diverge” against conventional is worth a read if traditional employment income documentation is the alternative on the table.
Investors who want a specific Brownsburg structure can start with Lendmire’s Indiana DSCR platform or call 828-256-2183 to talk through a file. Program details change, so confirm current guidelines before relying on any figure above. Verify current local rental rules, taxes, and insurance with qualified local professionals.
What About the Blended-Median Trap?
Niche reports a median home value of $309,400 and a median rent of $1,486, about 0.48 percent per month. Those are all-unit medians that blend apartments and houses. A well-chosen three- or four-bedroom house is a different animal, closer to 0.57 to 0.66 percent on the RentCafe and Zillow figures. A blended median makes coverage look weaker than a well-picked house, so don’t let one number talk you out of a good file. The reverse is just as true: don’t let apartment-building rents talk you into one.
Even the better ratio is thin for high-leverage cash-out. Brownsburg works best for the investor who bought right, holds a house with a documented lease near the stronger end of the rent band, and pulls equity at moderate leverage. It works poorly for anyone chasing the full 75 percent on a stretched value.
Frequently Asked Questions
How do you qualify for a DSCR cash-out refinance in Brownsburg?
The property has to show enough rent against its full monthly obligation, typically a 1.00 benchmark, with about six months of ownership from title recording and a credit score at or above the 620 floor. Reserves of around six months of PITIA are standard. Lenders then apply the 75 percent LTV ceiling to the appraised value, so the appraisal drives the outcome as much as the rent does.
DSCR vs. conventional financing
There are two common ways to finance an investment property in Brownsburg, IN, and they qualify you differently — here’s how investors weigh them.
Why investors choose it
- Qualifies on the property’s rental income — no personal tax returns, W-2s, or pay stubs needed to document income.
- No personal debt-to-income ceiling to clear, so existing mortgages and obligations don’t cap your borrowing the same way.
- Can be closed in an LLC, keeping the property inside a business entity.
- Built for scaling — not held to the limit on number of financed properties that conventional financing applies.
- Underwriting centers on the deal: generally qualifies when the rent covers the payment, a 1.00x coverage ratio being a common baseline (confirmed in underwriting).
- Designed specifically for investment property, including long-term and, where the program allows, short-term rentals.
Where it’s strong
- Often the lowest ongoing financing cost for a buyer who fully qualifies on personal income — a fit for a first property or a cost-first purchase.
Trade-offs for investors
- Requires full personal income documentation and must fit within a debt-to-income limit — salary, existing debts, and other mortgages all count.
- Typically held in your personal name rather than a business entity.
- Caps how many financed properties you can carry, which can become a ceiling as a portfolio grows.
- Evaluates you as a borrower as much as the property, which usually means more paperwork.
How investors usually choose: a first or single property often optimizes for the lowest financing cost; portfolio builders often optimize for leverage, vesting in an LLC, and scaling past conventional caps. The right answer depends on your goals, the property, and current guidelines — both paths run through select lenders in Lendmire’s wholesale network, with eligibility and terms confirmed in underwriting.
What are the requirements for an investment property loan in Brownsburg, Indiana?
Expect to show a property with a lease or supportable market rent, reserves set aside to cover several months of the full monthly obligation, and a credit profile that meets the lender’s minimum. Pricing and available terms vary by lender, borrower profile, property type, and full underwriting review. Leverage on a cash-out tops out at 75 percent LTV. Manufactured homes, log homes, and barndominiums fall outside these programs, which matters because some Hendricks County listings are rural or non-standard. Final eligibility depends on the lender, the borrower, and the property review.
Will the Labcorp campus push Brownsburg rents up?
Probably over time, but not on a schedule you can underwrite. Most of the 1,776 jobs are relocating from about six miles away, and only 300-plus are new. Construction hadn’t started on the reported timeline, with completion years away. Treat it as a demand floor for mid-market houses, not a reason to assume rent growth in a lender’s coverage calculation.
How much can a Brownsburg investor expect to pull out?
There is no safe single figure. Proceeds depend on the appraisal, rent used for lender review, reserves, and the 75 percent ceiling, and appraised values in this market have ranged from about $310K to $395K depending on the source. Model leverage off the conservative end. A lower loan amount often strengthens the coverage ratio, even though it reduces cash out.
For current guidelines and terms, see Lendmire’s DSCR loan programs page.
The Step Worth Doing First
Before pricing any Brownsburg cash-out, pull three leased single-family comps from the same part of town, not apartment averages, and set them beside the conservative end of the $310K to $395K value range. In a market where only about 27 percent of households rent, those three leases tell you whether the file clears at 75 percent or needs trimming.
About Lendmire
Lendmire is a non-QM mortgage brokerage (NMLS# 2371349) arranging DSCR investor loans in 41 markets, including Washington, D.C., through wholesale and investor-lending channels. The lender evaluates DSCR loans on rental income rather than personal income, subject to lender guidelines. That structure suits LLC-owned portfolios, self-employed investors, and operators scaling beyond conventional loan caps. Lendmire has been recognized as a top-ranked workplace in 2025 and a 2026 Scotsman Guide Top Mortgage Workplace.
Get Started
Ready to find the right loan for you?
In about 30 seconds you can review financing options available for your investment property. No commitment required.
Informational only. Not a Loan Estimate, approval, or commitment to lend. Program availability and eligibility are subject to lender guidelines, credit approval, property review, and underwriting.
References
1. RentCafe — Average Rent Market Trends Brownsburg
6. Rent.com
7. Zumper
8. Redfin
9. Niche
10. Point2Homes
11. Zillow — Home Values Brownsburg
13. Movoto — Brownsburg IN Market Trends
14. Redfin’s multi-family listings
18. Data USA
19. hoosierdata.in.gov — Major Employers
20. Hendricks County Economic Development Partnership
21. Census Bureau
22. Scotsman Guide — Top Workplaces 2025
23. a 2026 Scotsman Guide Top Mortgage Workplace
This article is part of Lendmire’s investment property cash-out refinance program — full qualification details, guidelines, and scenarios live on the program page.
Related reading: Luxury Rental DSCR Loans In New Jersey · Jersey Shore Vacation Rental Loans: DSCR Financing In Ocean City, Cape May And Long Beach Island · DSCR Cash-out Refinance In New Jersey: Pulling Equity From A Rental
Guides: Investment Property Cash-Out Refinance in Indiana
Brandon Miller
Founder & CEO, Mortgage Loan Originator, Lendmire LLC
- Mortgage Loan Originator · NMLS# 1129696 · Verify on NMLS Consumer Access
- North Carolina Real Estate Broker · License# 343312 · Verify on NCREC
- North Carolina Insurance Producer · License# 19053198 · Property, Casualty, Life, Health · Verify on NAIC SBS
- Lendmire LLC · Firm NMLS# 2371349 · Verify firm licensure
Important disclosures. Lendmire (NMLS# 2371349) is a licensed mortgage brokerage. Lendmire is not a direct lender, depository institution, or financial advisor. All loan inquiries are subject to lender underwriting; this article does not constitute a commitment to lend. Rates, terms, and program guidelines are subject to change without notice and vary by borrower profile, property type, and state. Information in this article is general in nature and is not financial, legal, or tax advice. Equal Housing Opportunity. NMLS Consumer Access: nmlsconsumeraccess.org.