
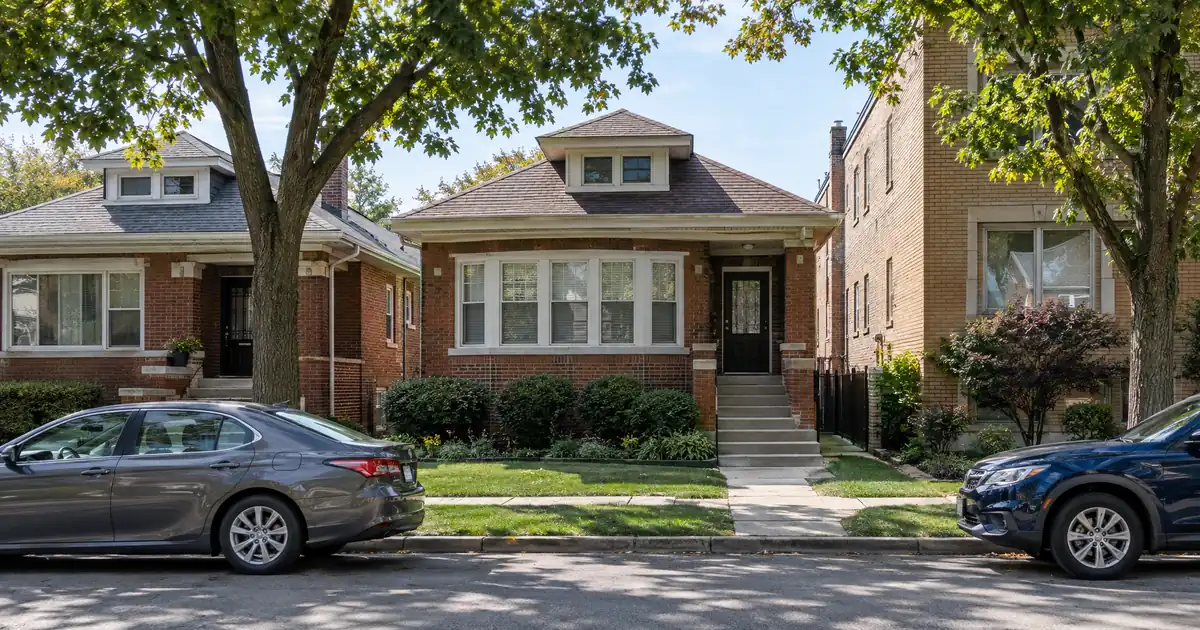
An out-of-state investor scrolling Oak Lawn listings sees a Chicago-adjacent village with a Level I trauma center and a Metra line, and assumes a deep small-rental market. The data says otherwise. According to NeighborhoodScout, duplexes, converted homes, and small apartment buildings are only 7.24% of Oak Lawn’s housing units. And RentCafe puts just 18% of households in renter-occupied units. This is a thin rental market, and thin markets punish sloppy cash-out assumptions. For Oak Lawn, Illinois rental property financing, Lendmire (NMLS# 2371349) helps arrange DSCR loans through lenders operating in 41 markets, including Washington, D.C.
This piece is about owners who already hold property here and want to pull equity out to fund the next acquisition. It skips purchase mechanics. It asks a harder question: which Oak Lawn properties can actually carry a cash-out refinance once taxes and insurance are in the debt service?
DSCR Cash-Out Calculator
Run the cash-out numbers in Oak Lawn, IL
Rate source: Freddie Mac 30-yr average via FRED® — Federal Reserve Bank of St. Louis · effective Sep 24, 2026
Prefilled with starting assumptions — enter your property’s value, balance, taxes, and insurance for a more accurate picture.
Program parameters update from Lendmire’s centralized guideline source. Taxes and insurance are editable estimates.
As of Sep 24, 2026 · General Freddie Mac market benchmark, not a Lendmire loan offer. Property value, balance, taxes, and insurance are editable estimates. Maximum loan-to-value varies by lender, program, property type, and seasoning. Not a Loan Estimate, approval, or commitment to lend. Program availability and eligibility are subject to lender guidelines, credit approval, property review, and underwriting.
The Short Version:
A DSCR cash-out refinance in Oak Lawn, Illinois is underwritten primarily on the rental property’s income measured against its full monthly obligation, with proceeds capped by loan-to-value limits and reserve requirements rather than by the owner’s personal income documentation. Terms vary by lender guidelines, property type, leverage, credit profile, and full file review.
- Cash-out LTV tops out at 75%, with ownership seasoning of about 6 months.
- Homes.com shows a $280,000 median sale price, up 4% over twelve months.
- Two-unit and four-unit buildings stack more rent per dollar of price than single-family homes.
- Portal rent data conflicts widely, so lease-supported rent is what drives the number.
- Reserves of roughly six months of PITIA are typical, subject to lender guidelines.
Oak Lawn Market Snapshot
A quick read on the Oak Lawn investor landscape — figures come from the cited sources below. Confirm current property-level numbers before underwriting.
| Metric | Detail |
|---|---|
| Home prices | $281,200 median value (Data USA, Oak Lawn) |
| Cap rates | 6–8% claimed (not used) (Sync Properties) |
| University enrollment | 600 med students (Wikipedia, Advocate Christ) |
| Employment | 22,666 jobs (Redfin, multi-family) |
Why Does Oak Lawn’s Equity Story Need a Skeptic’s Read?
Oak Lawn’s equity is real but modest, and most of the cash-out upside sits in multi-unit product, not the single-family homes that dominate the village. The market is mature, flat in population, and slow on appreciation, so proceeds depend on rent coverage more than on price momentum.
Start with growth. Wikipedia’s historical table, drawn from the Census, shows 56,690 residents in 2010 and 58,362 at the last decennial count. That is a mature suburb, not a growth story. NeighborhoodScout adds that Oak Lawn’s latest annual appreciation trails more than half of Illinois cities and towns. Homes.com’s local guide shows a $280,000 median sale price up 4% over twelve months, with 27 days on market. Data USA lands nearby at a $281,200 median property value, so the two agree that the citywide median sits in the low-to-mid $280,000s. NeighborhoodScout’s $358,103 median house value is the outlier, likely reflecting a different method, and it should not anchor anyone’s expectations.
Here is the catch for equity extraction. A 4% annual gain on a median-priced home adds modest paper equity per year. An owner who bought a few years ago at a flat-to-soft entry point may find the 75% LTV ceiling leaves little room above the existing balance. Cash-out here works best for investors who bought below market, renovated, or hold multi-unit product where income, not comparable sales, carries the valuation. Everyone else should run the numbers before ordering an appraisal. Exact terms depend on the lender’s guidelines, property type, leverage, and a full review of the borrower’s file.
The rental picture is messier still. Homes.com reports a median rent of $1,800, with single-family homes at $2,495, townhouses at $1,895, and condos at $1,700. Zumper says $1,450. Redfin’s older snapshot says $1,250, and U.S. News says $1,187. The spread reflects listing rents versus all-tenant rents. So the responsible read is a band, not a number, and the cash-out file should rest on signed leases or an appraiser’s market-rent schedule.
The Coverage Math: One Unit Versus Two
Multi-unit buildings clear the 1.00 baseline with room to spare, while median-priced single-family rentals hover at or below it. The difference comes from stacking rent on a modestly higher basis, and it decides how much equity a lender will let an owner extract.
Consider the modeled comparison below. These are illustrative assumptions, not underwritten figures. Coverage is rent divided by full PITIA (principal, interest, taxes, and insurance) at 75% LTV on a 30-year amortization, using Illinois-average tax and insurance loads. Every figure here varies by lender and program — guidelines, property type, leverage, and credit profile all apply.
| Scenario | Modeled rent basis | Coverage (incl. Taxes and insurance) |
|---|---|---|
| SFR near the $280,000 median | Median rent of $1,800 | Below 1.00 |
| SFR near $323,000, 3BR house | $2,495 house rent | Roughly 1.05-1.10x |
| Duplex near $322,500 | Two 2BR units, $1,600-$1,700 each | Roughly 1.30-1.40x |
| Downtown condo/SFR near $237,000 | $1,700 median rent | Right around 1.00x |
Three points on that table. First, the $322,500 duplex figure comes from a single Realmo listing, so it is an illustration, not a market median. Second, Homes.com’s multi-family page shows only three multi-family homes listed, priced from $179,000 to $549,900, so the sample is thin. Third, the rent inputs for two-bedroom units come from Zumper asking rents, roughly $1,600 to $1,700 per unit. Two such units gross about $3,200 to $3,400 monthly, versus $2,495 for the Homes.com single-family house rent. That is about 30% more income on a price that is only modestly higher.
That gap is the whole thesis. In practice, a 2-flat can push coverage past 1.00 where a comparable house cannot, and that raises the loan amount a lender may support against the property.
What if the coverage falls short? A standard program is built around a 1.00 benchmark because the rent covers the payment at that level. Some lenders review sub-1.00 scenarios, but those usually require lower leverage, stronger reserves, different pricing, or more compensating factors, and eligibility depends on lender guidelines, credit profile, and property review. Interest-only structuring is another path a lender might review. None of it is automatic. The single-family owner at the median should treat a sub-1.00 file as an exception to be worked, not a default.
Where the Equity Sits: Two-Flats, Four-Flats, and the Corridor
The strongest cash-out candidates are legal two-flats and bungalow duplexes near the Metra and 95th Street, followed by small brick four-unit buildings. Both are scarce, which helps the income story and hurts the appraisal story.
Listings on Homes.com’s 60453 page include a legal two-unit bungalow in the “Little Beverly” pocket, steps from the Metra. That name comes from a listing agent, not a defined neighborhood boundary, so treat it as a description. A separate listing describes a custom-built four-unit brick building with two-bedroom, two-bath units. Four units is where income stacking peaks inside a 1-4 unit DSCR program, though only a few such buildings appear at any time.
Larger stock exists. The same listings show a fully occupied 12-unit building and a 28-unit, three-building property, both of one- and two-bedroom apartments. These typically move into commercial or multifamily underwriting, outside the 1-4 unit DSCR programs. An owner of a 12-unit building reading a DSCR article should not expect it to apply.
Downtown Oak Lawn (the 95th Street and Metra spine)
Downtown Oak Lawn is the corridor with the clearest demand anchors and the softest recent pricing. Redfin’s neighborhood data shows a $237,000 median sale price over three months, down 7.8% year over year, with homes selling in around 63 days. Redfin’s rental page shows a $1,700 median rent there, though that snapshot is dated and comes from an older update.
Read the sign of that price move carefully. A falling comp set is the opposite of what a cash-out borrower wants. If an appraiser leans on recent downtown sales, the value may not support the equity the owner expected. The modeled coverage is right around the 1.00 line at that price and rent, which leaves no cushion. Skip this pocket for aggressive extraction unless the building is a multi-unit with documented leases.
Alsip and the Southwest Side spillover
Redfin lists Village of Alsip and the Far Southwest Side among popular nearby areas, with median rents of $1,400 and $1,287. Zumper says Oak Lawn’s median rent runs 21% above Alsip’s. That gap matters for owners deciding whether to hold in Oak Lawn or redeploy proceeds next door. Lower rents with no sourced price data for those areas means the coverage math there is unverified. The research found no reliable price series for Minnicks, Little Palestine, or Mount Greenwood, so those areas deserve their own comp work before anyone underwrites them.
Tenant Demand: A Hospital, a Rail Line, and Some Honest Limits
Advocate Christ Medical Center is the demand anchor that makes Oak Lawn rentals reviewable on paper. It anchors a spread of tenant types rather than a single-employer bet, which is what a hold-and-refinance plan wants. It also does not fix a thin comp base.
Advocate Christ Medical Center at 95th Street reports 700+ beds and 1,500 affiliated physicians, and its hospital information page cites more than 105,000 emergency visits annually and one of the busiest Level I trauma centers in Illinois. Per Wikipedia’s summary, the campus trains more than 400 residents, 600 medical students, and 800 nursing students each year. That is a rotating pool of trainees and staff who want housing near the campus and the Metra. The hospital’s advertised bed count differs from Wikipedia’s 788, so use the hospital’s own figure.
Local property management commentary describes the tenant mix as healthcare workers, families priced out of Orland Park and Tinley Park, and Metra or expressway commuters. That source is promotional, so weight it as qualitative. Still, three overlapping tenant groups spread vacancy risk better than dependence on one employer.
The resident economy backs this up without being dramatic. Data USA lists health care and social assistance (3,655 residents), retail trade (3,171), and educational services (2,833) as top sectors, and the Village’s annual financial report shows a 4.5% unemployment rate. Now the skeptic’s side. City-Data shows 5,871 workers who live and work in the village, about 21.2%, and a negative daytime population change of 2,743. A large share of residents commute out, and this is not a college town: Data USA lists only a beauty academy as a local institution.
What Is the Catch on Thin Rental Comps?
The catch is that a small renter pool means fewer rent and sales comparables, and that shows up in the appraisal. Renters are 18% of households, or 3,805 units, and 2-4 unit product is about 7% of stock. Appraisers working with few closed comps lean on whatever is closest, which can be a poor match.
This cuts both ways. Limited competing supply plus rental listings averaging about 25 days on market, per RentalSource, suggests demand holds up. No reliable vacancy rate turned up in the research, so that inference is directional. The bigger risk is documentation. Rents published by portals range from a $1,156 average on Apartments.com to $1,800-plus for a two-bedroom on ApartmentList. Zumper shows a 10.8% year-over-year jump while its own page notes a monthly decline of 4.87%. Do not underwrite a cash-out on a portal headline.
Lendmire’s deal desk sees a familiar pattern in markets with a shallow rental pool like this one. The cleaner files tend to arrive with executed leases, rent rolls that match the appraiser’s market-rent schedule, and reserves already seasoned in the account. The common friction point is a borrower whose stated rent sits well above the appraisal’s number, forcing the ratio to be recalculated on the lower figure. Pulling lease documentation together before the appraisal is ordered avoids that.
For a broader look at how the coverage test is built, see the guide “What Is a DSCR Loan”.
Working the Parameters: 75%, Six Months, and Reserves
The cash-out ceiling is 75% LTV, with about six months of ownership seasoning measured from title recording, a 1.00 minimum DSCR, and reserves around six months of PITIA. These are typical program guidelines, subject to lender overlays, not guarantees. Final terms depend on lender guidelines, property type, leverage, and the borrower’s complete credit picture.
Credit tiers step up from a 620 floor through 660, 680, and 700, and better tiers generally improve leverage and pricing options. Standard programs run up to $3,000,000 in loan amount, with smaller balances routed through select lenders in the network. Oak Lawn’s price points sit far below that ceiling. The constraint here is the 75% cap combined with a soft appreciation pace, not loan size.
Picture an owner who bought a bungalow two-flat and has held it just past six months. Equity available depends on the rent used for lender review, the debt service, the reserves, and the appraisal, and the result is not a guaranteed cash figure. Where the owner has renovated or re-leased at higher rents, the property may support more proceeds. Where the owner is simply waiting on 4% appreciation, the 75% cap may leave little. The same logic applies to a rate-and-term move, which is a different kind of refinance with its own options. For the mechanics of extraction itself, pulling equity out covers the framework, and the tradeoffs between conventional and DSCR loans explain why owners with several rental properties often route through property-income underwriting.
Investors should verify current local rental rules, taxes, and insurance with qualified local professionals. Also confirm ADU eligibility directly with the Village, since the research found no Oak Lawn-specific ADU data. Investors comparing lender options can compare DSCR options or call 828-256-2183. Those working across the state can also review Lendmire’s Illinois DSCR investor loans page.
Where Proceeds Go Next: A Toss-Up
The redeployment question is a genuine toss-up. Recycling proceeds into another Oak Lawn two-flat keeps the investor inside a known tenant base, but the thin inventory means few targets. Alsip and the Far Southwest Side offer lower rents with unverified price data. The stronger play might be buying multi-unit product where coverage clears 1.20x on documented rents, though investors chasing appreciation could argue for a different metro entirely, given how Oak Lawn trails other Illinois cities on that measure.
DSCR vs. conventional financing
Two common ways to finance an investment property in Oak Lawn, IL. They qualify you differently — here’s how investors weigh them.
Why investors choose it
- Qualifies on the property’s rental income — no personal tax returns, W-2s, or pay stubs needed to document income.
- No personal debt-to-income ceiling to clear, so existing mortgages and obligations don’t cap your borrowing the same way.
- Can be closed in an LLC, keeping the property inside a business entity.
- Built for scaling — not held to the limit on number of financed properties that conventional financing applies.
- Underwriting centers on the deal: generally qualifies when the rent covers the payment, a 1.00x coverage ratio being a common baseline (confirmed in underwriting).
- Designed specifically for investment property, including long-term and, where the program allows, short-term rentals.
Where it’s strong
- Often the lowest ongoing financing cost for a buyer who fully qualifies on personal income — a fit for a first property or a cost-first purchase.
Trade-offs for investors
- Requires full personal income documentation and must fit within a debt-to-income limit — salary, existing debts, and other mortgages all count.
- Typically held in your personal name rather than a business entity.
- Caps how many financed properties you can carry, which can become a ceiling as a portfolio grows.
- Evaluates you as a borrower as much as the property, which usually means more paperwork.
How investors usually choose: a first or single property often optimizes for the lowest financing cost; portfolio builders often optimize for leverage, vesting in an LLC, and scaling past conventional caps. The right answer depends on your goals, the property, and current guidelines — both paths run through select lenders in Lendmire’s wholesale network, with eligibility and terms confirmed in underwriting.
A working rule: extract only what the coverage ratio supports comfortably after reserves, and avoid pushing leverage to the 75% ceiling on a property whose rent is supported only by asking-rent listings.
Frequently Asked Questions
Does the 75% LTV cap leave real room in Oak Lawn?
Only for the right owners. With citywide appreciation running about 4% over twelve months, owners who bought near the median recently may find little space between their balance and 75% of value. Owners who renovated, re-leased at higher rents, or bought below market are better positioned. Eligibility is subject to lender guidelines and appraisal.
Which Oak Lawn property types tend to carry a cash-out best?
Legal two-flats and small brick four-unit buildings, because stacked rents lift coverage above what a single house can produce. Modeled, a duplex can gross roughly 30% more than a single-family rental at a modestly higher price. Buildings of 12 or more units usually leave the 1-4 unit DSCR programs and move to commercial underwriting.
How should a borrower handle Oak Lawn’s conflicting rent data?
Anchor to signed leases and the appraiser’s market-rent schedule, not portal averages. Sources range from $1,187 to $1,800 for median rent depending on method, and none of them replaces documented tenant income. A lender will generally use the lower of lease and appraised market rent.
Is Oak Lawn a good place to hold if the goal is appreciation?
Probably not on appreciation alone. NeighborhoodScout says Oak Lawn’s latest annual appreciation is lower than 50% of Illinois cities and towns, and downtown pricing fell 7.8% year over year. The case here is income and tenant stability, anchored by the hospital and Metra, not price momentum.
What does the 6-month seasoning requirement mean for a recent buyer?
Roughly six months of ownership, measured from title recording, is typical before a cash-out can be considered. An investor who bought a two-flat and finished a renovation inside that window generally waits out the clock, and the appraisal then captures the improved rents and condition.
What the Next Cycle Likely Brings
Expect Oak Lawn to reward income properties over appreciation plays across the coming 6-24 months. Population has barely moved in a decade, so equity growth will keep leaning on rent, not price. Downtown’s 7.8% pullback is the risk to watch: if it spreads, cash-out proceeds on single-family homes shrink, while documented two-flats and four-flats near the Metra and Advocate Christ campus should keep clearing the coverage test. The village’s scarce small-multifamily stock, about 7% of housing units, is the reason those buildings hold their value better than the median house.
For current guidelines and terms, see Lendmire’s DSCR loan programs page.
About Lendmire
Lendmire (NMLS# 2371349), a non-QM mortgage broker serving investors in 41 markets including Washington, D.C., helps structure DSCR scenarios commonly evaluated around a property’s rental income rather than personal income paperwork, subject to lender guidelines. Recognized as a top-ranked workplace in 2025 and a top-ranked workplace in 2026 by Scotsman Guide, Lendmire places loans through wholesale investor lenders and is not a direct lender.
Get Started
Ready to find the right loan for you?
In about 30 seconds you can review financing options available for your investment property. No commitment required.
Informational only. Not a Loan Estimate, approval, or commitment to lend. Program availability and eligibility are subject to lender guidelines, credit approval, property review, and underwriting.
References
1. NeighborhoodScout, Oak Lawn real estate
2. RentCafe, Oak Lawn rent trends
3. Homes.com, Oak Lawn local guide
8. Wikipedia — Oak Lawn, Illinois
9. Homes.com — Oak Lawn IL Homes for Rent
10. Realmo listing
11. Homes.com’s multi-family page
13. Redfin, Downtown Oak Lawn housing market
14. Advocate Christ Medical Center
15. advocatehealth.com — Patients Visitors Hospital Information
16. Village of Oak Lawn annual financial report
17. RentalSource
18. Scotsman Guide — Top Workplaces 2025
19. Scotsman Guide — Top Workplaces 2026
This article is part of Lendmire’s investment property cash-out refinance program — full qualification details, guidelines, and scenarios live on the program page.
Related reading: Cash Out Refinance on Oak Lawn Investment Property via DSCR · DSCR Cash Out Refinance Oak Park Illinois · DSCR Cash Out Refinance for Crystal Lake IL Landlords
Guides: Investment Property Cash-Out Refinance in Oak Lawn, IL · Investment Property Cash-Out Refinance in Illinois
Brandon Miller
Founder & CEO, Mortgage Loan Originator, Lendmire LLC
- Mortgage Loan Originator · NMLS# 1129696 · Verify on NMLS Consumer Access
- North Carolina Real Estate Broker · License# 343312 · Verify on NCREC
- North Carolina Insurance Producer · License# 19053198 · Property, Casualty, Life, Health · Verify on NAIC SBS
- Lendmire LLC · Firm NMLS# 2371349 · Verify firm licensure
Compliance and disclosures. Lendmire (NMLS# 2371349) is a licensed mortgage broker and is not a direct lender, depository institution, financial advisor, or tax professional. Content in this article is general market analysis and educational information — not financial, legal, or tax advice for any specific situation. Lendmire does not guarantee loan approval; every transaction is subject to underwriting by the funding lender. Mortgage pricing and loan program guidelines are subject to change at any time without notice and vary by borrower characteristics, property type, and state regulations. Lendmire complies with Equal Housing Opportunity. Licensure verification: NMLS Consumer Access.