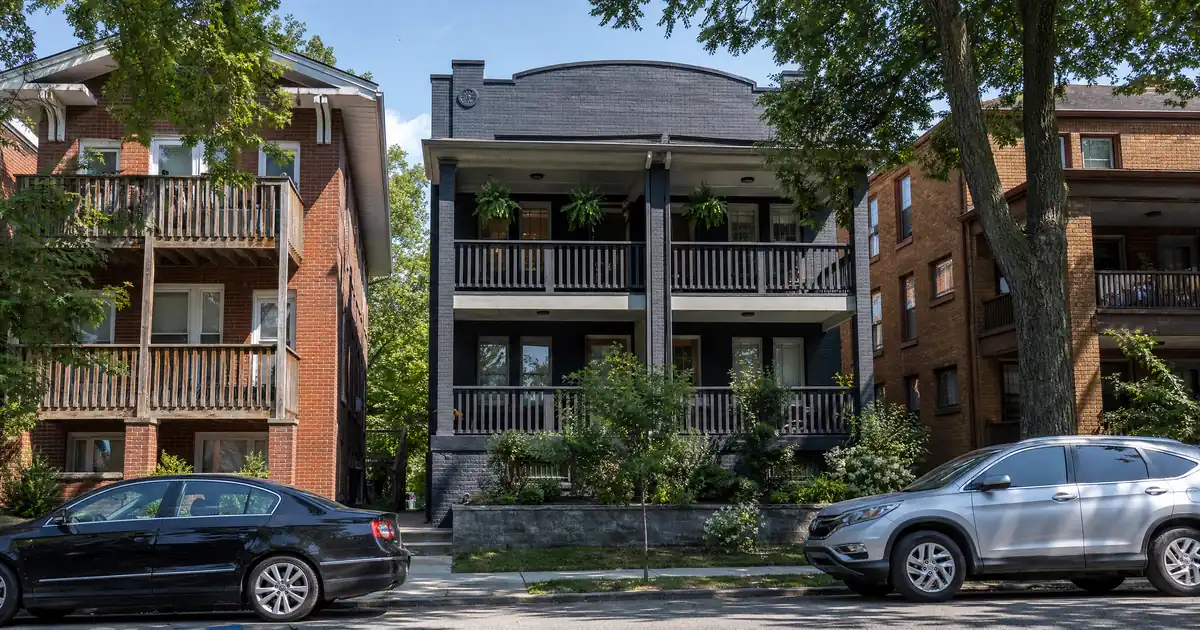
South Linden doesn’t look like much on a drive-through, but the numbers are hard to argue with. Median home price sits at $165,000, average sale price at $145,850, according to Homes.com multi-family listing data, and the neighborhood sits close enough to Ohio State’s medical campus, John Glenn Columbus International Airport, and Ohio State East Hospital that tenant demand doesn’t require a marketing campaign. That combination — low basis, steady tenant pull — is exactly what makes small multifamily acquisition work in this metro when the citywide numbers don’t.
The Quick Read: Investment property loans in Columbus, Ohio underwrite best for buyers targeting small multifamily in the urban cash-flow ring rather than single-family purchases at the citywide median, because rent-to-price math clears coverage in neighborhoods like South Linden and Marion-Franklin while it falls short at Columbus’s median home price of $275,000 against median rent of $1,300, per one DSCR estimator’s citywide read.
DSCR Calculator
Run the numbers in Columbus, OH
Rate source: Freddie Mac 30-yr average via FRED® — Federal Reserve Bank of St. Louis · effective Jul 16, 2026
Prefilled with local estimates — enter your own rent or nightly figures, taxes, insurance, and HOA for a more accurate picture.
As of Jul 16, 2026 · General Freddie Mac market benchmark, not a Lendmire loan offer. Rent, nightly rate, occupancy, taxes, and insurance are editable estimates. Short-term rental figures are estimates only and vary significantly by season, property type, management approach, and local short-term-rental rules — confirm local regulations before relying on them. Qualifying income for short-term rentals varies by program — some use appraisal market rent, others use documented STR history or projections — and is confirmed in underwriting. Not a Loan Estimate, approval, or commitment to lend. Program availability and eligibility are subject to lender guidelines, credit approval, property review, and underwriting.
- South Linden, Hilltop, Franklinton, Whitehall, and Eastmoor run 7 to 10 percent cap rates.
- First-ring suburbs (Reynoldsburg, Morse Road corridor, Lincoln Village) run 6 to 8 percent.
- Citywide median rent-to-price ratio is roughly 0.47 percent — thin for coverage.
- Linden carries a 12.4 percent vacancy rate per NeighborhoodScout — underwrite for turnover.
- Premium suburbs like Dublin and New Albany run 4 to 6 percent and lean on appreciation, not cash flow.
Columbus Market Snapshot
A quick read on the Columbus investor landscape — figures come from the cited sources below. Confirm current property-level numbers before underwriting.
| Metric | Detail |
|---|---|
| Home prices | $335,000 MLS median price (RL Property Management) |
| Typical rents | $1,465 average (Zillow Rental Manager Market) |
| Cap rates | 7-10% urban cap rates (RL Property Management) |
| University enrollment | 67,255 total enrollment (Ohio State University News) |
| Employment | OSU Wexner 13,000+ staff (Central Ohio Hospital Council) |
| Vacancy | 12.4% (NeighborhoodScout) |
The Citywide Median Is a Trap
At the metro average, Columbus DSCR math is genuinely tight — and any investor pricing a purchase off the citywide median without checking submarket rents is setting up a file that won’t clear coverage. A citywide back-of-envelope — a $275,000 median home price against $1,300 median rent — pencils to a rent-to-price ratio of just 0.47 percent. Run that through a typical 75 percent LTV purchase and the estimated coverage lands near 0.73 — a ratio that, if it holds up under lender review, would likely require a no-ratio program, materially reduced leverage, or interest-only restructuring to make the file work.
That’s not a knock on Columbus. It’s a reminder that “the metro” isn’t a submarket. A separate market read notes Columbus properties often sit closer to a 1.0 to 1.15 coverage ratio at median prices, with investors leaning on equity growth to make up the difference — which is true, but incomplete. It skips the part where certain Columbus neighborhoods clear a stronger ratio right now, without betting on appreciation to bail out a thin file. That’s the gap this article is built to close.
| Submarket Tier | Cap Rate Range | Best Fit |
|---|---|---|
| Urban cash-flow ring (Hilltop, Linden, Franklinton) | 7-10 percent | Duplex, triplex cash flow |
| First-ring suburbs (Reynoldsburg, Morse Rd corridor) | 6-8 percent | Workforce SFR, 1-5 units |
| Premium suburbs (Dublin, Powell, New Albany) | 4-6 percent | Appreciation, low cash flow |
South Linden and the Duplex Math That Actually Clears
Run the numbers on a South Linden purchase and the case for small multifamily over single-family becomes obvious. Using NeighborhoodScout’s reported average rent of $1,642 against South Linden’s $165,000 median price, the rent-to-price ratio comes in right around 0.99 percent — essentially the classic “1 percent rule” threshold that citywide numbers can’t touch.
Model that purchase at 75 percent LTV with a modeled financing-cost assumption, and full PITIA — principal, interest, taxes, and insurance — comes out against South Linden’s $1,642 average rent to a modeled coverage ratio near 1.35x, nearly double the citywide estimate. This is a modeled assumption built from sourced rent and price figures, not a lender-quoted outcome — actual underwriting depends on the specific unit mix, condition, and lender review.
That gap between citywide and submarket math is the whole thesis for buying in Columbus right now. Duplex and triplex product in the Linden and Hilltop corridors — the kind of durable block-construction builds locals call “1 percent rule” stock — is where the income side of DSCR actually stacks up. Actual Redfin-listed comps back this up: a duplex near Bexley with two 3BR units renting at $1,400 and $1,320 a month runs north of a 10 percent cap rate, while a four-unit building with units averaging $1,600 a month runs closer to 7.8 percent. Spread the same per-unit rent dollars across a single-family purchase at the citywide median price, and coverage doesn’t clear the same way — the unit count is doing the work.
Hilltop, Franklinton, Whitehall, and Eastmoor: The Rest of the Cash-Flow Ring
These four neighborhoods round out Columbus’s strongest rent-to-price corridor, running 7 to 10 percent cap rates alongside South Linden and rewarding investors who plan to self-manage or hire a hands-on property manager. Franklinton in particular is mid-transformation — new mixed-use development, breweries, and cultural venues are pulling foot traffic and reshaping the neighborhood’s rental profile, though it’s still earlier in that arc than Linden’s redevelopment push. Whitehall and Eastmoor lean more purely workforce-tenant, with less of the speculative redevelopment story attached.
None of this is passive-income-on-autopilot territory. This is the tier where DSCR coverage is strongest precisely because the tenant base and property condition require active oversight — plan for turnover, plan for maintenance calls, and don’t buy here expecting a hands-off hold.
Marion-Franklin’s Yield Is Real — But Read the Tenant Base Right
Marion-Franklin stands alone in Columbus for pure rental yield: it’s one of the few neighborhoods in the metro with rental yield exceeding 10 percent. What drives it isn’t gentrification or redevelopment dollars — it’s the surrounding industrial parks, warehouses, logistics facilities, and manufacturing employers that sit adjacent to the neighborhood. That employment base tends to produce longer-tenure, lower-mobility tenants: workers who commute short distances and don’t churn through leases the way a more transient renter pool would.
For DSCR purposes, that’s a favorable seasoning profile — steady occupancy supports the kind of trailing rent history a lender wants to see on a file. The tradeoff is limited upside on appreciation compared to a redevelopment-story neighborhood like Linden. Marion-Franklin is a cash-flow play, full stop, not a “buy it and watch it double” play.
Linden’s Redevelopment Tailwind (And Its Vacancy Catch)
Linden is where Columbus’s appreciation and cash-flow stories genuinely overlap — but the vacancy data means it isn’t a clean bet either way. Median price sits at $153,234 with average rent of $1,642, per NeighborhoodScout, and the neighborhood is in the middle of the ONE Linden redevelopment initiative, a $50 million-plus public and private investment push that’s a real appreciation tailwind for multi-unit owners holding through the cycle.
Here’s the catch: Linden carries a 12.4 percent vacancy rate, well above the average for comparable U.S. neighborhoods. That’s not a number to gloss over. Investors underwriting a Linden duplex should build turnover and vacancy loss into their rent projections rather than assuming the average rent figure holds twelve months a year. The redevelopment dollars are real, and the rent-to-price math is genuinely attractive — but the vacancy rate says this is a neighborhood for investors who’ve priced in tenant churn, not ones expecting a set-it-and-forget-it hold.
First-Ring Workforce Suburbs: Reynoldsburg, Morse Road, Lincoln Village
The Morse Road/SR 161 corridor — running through Northland, Gahanna, and Westerville — along with Hamilton Road, Lincoln Village, and Reynoldsburg offers the cleanest balance in the metro between affordability and rental demand for entry-level 1 to 5 unit portfolios. Cap rates here run 6 to 8 percent, a notch below the urban cash-flow ring but with a meaningfully calmer tenant base and less active-management overhead.
Reynoldsburg specifically has seen a notable pickup in year-over-year sales activity, which tracks with what the workforce-suburb thesis predicts: affordable entry points paired with solid, unglamorous rental demand. This is the tier a first-time Columbus DSCR investor should look at first — not because it’s the highest-yielding option on the board, but because it’s the option most forgiving of a management misstep. The stronger play for a new investor might actually be Reynoldsburg over South Linden, even though the South Linden numbers look better on paper — the tenant base requires less hands-on intervention, and that matters more than an extra point or two of cap rate when it’s someone’s first rental property.
Weinland Park and the University District: Betting on OSU, Not Cash Flow Today
This submarket is an appreciation and demand-stability play, not a day-one cash-flow play — investors here are underwriting to Ohio State’s structural housing shortage, not to a strong rent-to-price ratio at close. Weinland Park’s median home price sits at $387,450 per one December data pull, though NeighborhoodScout puts the figure meaningfully higher, closer to $577,362, with average rent around $2,123 — a wide enough spread between sources that buyers should verify current comps directly before pricing an offer.
Ohio State University hit record enrollment of 67,255 students, and the university has had to extend its off-campus housing agreement with StateHouse’s Lane and Norwich properties through the 2027-28 school year, securing 500 additional beds because on-campus capacity can’t keep pace with enrollment growth, according to The Lantern. That’s a multi-year contractual demand tailwind for off-campus rentals near campus — a rare case where a university’s own housing shortage is doing the underwriting work for a landlord. It doesn’t fix a thin coverage ratio at purchase, though. This is a neighborhood for investors comfortable carrying tighter day-one numbers in exchange for demand stability that’s locked in through at least the 2027-28 academic year.
Skip These for Cash Flow
Dublin, Powell, New Albany, and Upper Arlington are appreciation plays, not income plays — cap rates in this tier run 4 to 6 percent, and the entry prices simply don’t leave room for strong day-one coverage. These are the neighborhoods pulling high-earning professionals drawn to top-rated districts, with low vacancy and strong lease renewals, but the acquisition cost eats the yield. Buy here for the long hold and the school-district demand base, not for a DSCR file that clears comfortably.
Worth a caution flag too: new multifamily deliveries have concentrated heavily in specific zones — Delaware County accounted for 31 percent of units delivered, Downtown Columbus 17 percent, and Upper Arlington 15 percent, per Swiss Realty Group’s Q2 analysis. Vacancy across mid-tier institutional apartment product hit 9.1 percent, the highest level in nearly two decades. That figure applies to large-scale Class-B apartment buildings, not the 2-4 unit walk-up stock that dominates Linden or Hilltop — but if a lender or appraiser cites “Columbus multifamily vacancy” as a comp on a cash-out or purchase file in these specific zones, it’s worth flagging the difference in asset class.
The Intel Timeline Reset (What It Means for New Albany and Licking County)
Intel’s $28 billion investment in two chip factories near New Albany, spanning nearly 1,000 acres on a site that could eventually host up to eight fabs, is the largest single private-sector investment in Ohio history, according to Intel’s own press materials. It’s also been delayed twice — the project is now expected to reach operational status in the early 2030s, with the first fab completing around 2030 and the second a year or two later. Anyone who bought land or rentals near New Albany or Johnstown on a 12-to-24-month flip-to-refi thesis needs to reset that clock. This is patient capital now, not a near-term catalyst.
That said, the tenant demand in Licking County doesn’t hinge entirely on Intel’s fab opening. Amazon has invested $6.2 billion in AWS data center infrastructure in Licking County, generating roughly $1.4 billion in GDP and supporting an estimated 1,550 full-time equivalent jobs annually, according to the City of New Albany — and that’s alongside operational Meta, Google, Microsoft, and Cologix campuses already paying wages today. The data-center employment base gives workforce rentals in that corridor a demand floor independent of whatever happens with Intel’s timeline. This one’s a genuine judgment call: buy now for the eventual Intel-driven appreciation and accept a multi-year wait, or treat the area as a present-tense data-center-adjacent workforce play and let Intel be a bonus rather than the thesis.
What Actually Qualifies
Standard DSCR programs in this metro typically run 75 to 80 percent LTV on a purchase, about 20 to 25 percent down, with select high-leverage files reaching up to 85 percent when the file is strong. Minimum coverage on a 1.00x floor available on select programs, with most standard files underwritten to stronger coverage above that baseline — meaning rent covers the full monthly obligation at that level — though credit tiers, reserves, and property type all factor into what a given lender will approve. Credit floors in the network start around 620, with higher-leverage options generally requiring stronger credit, and reserve requirements typically run about six months of PITIA, rising to roughly nine months on loans above 1.5 million dollars. None of these figures are guarantees; every file is subject to lender guidelines, credit approval, and property-level review.
Given the citywide 0.73 estimated coverage figure discussed earlier, Columbus is a market where property selection does more of the underwriting work than leverage assumptions. A buyer targeting Hilltop or South Linden duplex product is working with a fundamentally different coverage profile than a buyer purchasing a single-family home at the $275,000 metro median — and that difference should drive where an investor shops, not just what they can qualify for. Lendmire’s primer on DSCR loans covers how the ratio is calculated in more detail, and the conventional-vs-DSCR comparison breaks down when a rental-income-based structure makes more sense than a traditional income-documented loan.
Deal desks reviewing files from markets structurally similar to Columbus — diversified metro economies, no single dominant employer, a mix of urban high-yield pockets and appreciation-driven suburbs — tend to see the same recurring friction point: purchase contracts and rent rolls that were priced off citywide averages rather than the actual submarket comps. The cleanest files from a documentation standpoint have complete leases, entity formation documents, title work, and property condition details assembled before the file goes to underwriting, with rent figures pulled from the specific census tract or neighborhood rather than a metro-wide rent report. That single step tends to separate the files that clear coverage cleanly from the ones that need a second look at leverage or structure.
DSCR vs. conventional financing
Two common ways to finance an investment property in Columbus, OH. They qualify you differently — here’s how investors weigh them.
Why investors choose it
- Qualifies on the property’s rental income — no personal tax returns, W-2s, or pay stubs needed to document income.
- No personal debt-to-income ceiling to clear, so existing mortgages and obligations don’t cap your borrowing the same way.
- Can be closed in an LLC, keeping the property inside a business entity.
- Built for scaling — not held to the limit on number of financed properties that conventional financing applies.
- Underwriting centers on the deal: generally qualifies when the rent covers the payment, a 1.00x coverage ratio being a common baseline (confirmed in underwriting).
- Designed specifically for investment property, including long-term and, where the program allows, short-term rentals.
Where it’s strong
- Often the lowest ongoing financing cost for a buyer who fully qualifies on personal income — a fit for a first property or a cost-first purchase.
Trade-offs for investors
- Requires full personal income documentation and must fit within a debt-to-income limit — salary, existing debts, and other mortgages all count.
- Typically held in your personal name rather than a business entity.
- Caps how many financed properties you can carry, which can become a ceiling as a portfolio grows.
- Evaluates you as a borrower as much as the property, which usually means more paperwork.
How investors usually choose: a first or single property often optimizes for the lowest financing cost; portfolio builders often optimize for leverage, vesting in an LLC, and scaling past conventional caps. The right answer depends on your goals, the property, and current guidelines — both paths run through select lenders in Lendmire’s wholesale network, with eligibility and terms confirmed in underwriting.
Frequently Asked Questions
How do you qualify for a DSCR loan in Columbus, Ohio?
Qualification centers on the property’s rental income measured against its full monthly obligation, not personal income documentation. Most files run 75 to 80 percent LTV with a 1.00x coverage benchmark on standard programs, though credit profile, reserves, and property type all factor in. Given how much coverage varies by Columbus submarket — strong in Hilltop and South Linden, thin at the citywide median — the property itself often matters more than the borrower’s income history.
What are the requirements for an investment property loan in Columbus, Ohio?
Typical requirements include roughly 20 to 25 percent down, a credit score generally starting around 620 depending on leverage requested, and reserves of about six months of PITIA on standard loan sizes. Because Columbus rent-to-price ratios vary sharply by neighborhood, lenders will look closely at the specific market rent supporting the coverage ratio rather than relying on a citywide average.
Why do some Columbus properties need a no-ratio or interest-only structure?
At the citywide median price of $275,000 against median rent of $1,300, estimated coverage lands near 0.73 at standard 75 percent leverage — below the typical 1.00x benchmark. In that scenario, a no-ratio program, reduced leverage, or an interest-only structure may be reviewed as alternatives, subject to lender guidelines and credit approval, but none of these outcomes are guaranteed.
Does the Intel delay in New Albany change how a DSCR file should be underwritten?
It changes the appreciation timeline, not necessarily the rental-income underwriting. Intel’s fabs are now projected for the early 2030s rather than 2026, which pushes back the appreciation catalyst investors may have priced in near New Albany and Johnstown. The Amazon-anchored data center cluster in Licking County, however, already supports workforce rental demand today, independent of Intel’s schedule.
Can an LLC-owned Columbus rental be reviewed for DSCR financing?
Loans to LLC-titled entities can be reviewed, subject to lender program eligibility.
Is the University District a good bet for a first Columbus rental purchase?
It depends on what the buyer is optimizing for. Weinland Park and the broader University District carry higher entry prices and a wider rent-to-price gap than the Hilltop or Linden corridor, but Ohio State’s enrollment growth and extended off-campus housing agreements through 2027-28 give it demand stability that newer investors may find easier to underwrite than a higher-turnover cash-flow neighborhood.
For investors ready to move on a specific submarket, Lendmire’s team can be reached at 828-256-2183, and Lendmire’s Ohio DSCR platform outlines program parameters specific to the state.
The Choice in Front of You
Columbus doesn’t hand an investor one obvious answer, and that’s really the point of running the submarket numbers instead of the citywide ones. One path is the Hilltop-South Linden-Marion-Franklin corridor: entry prices in the $150,000 to $200,000 range, cap rates running 7 to 10 percent, and rent-to-price math that clears coverage without leaning on appreciation — in exchange for active management, real turnover risk, and a tenant base that requires attention. The other path is the first-ring suburbs or the University District: calmer management, contractual demand stability from Ohio State’s housing shortage or steady workforce tenancy in Reynoldsburg and the Morse Road corridor, and thinner day-one coverage that bets more on the region’s structural housing shortfall than on immediate cash flow. Neither path is wrong. They’re just different bets on what Columbus becomes over the next several years — and an investor who picks one without understanding the tradeoff of the other is underwriting half a deal.
For broader investor-financing rules and property-type coverage across the state, see Ohio DSCR loans.
About Lendmire
Lendmire (NMLS# 2371349) is a non-QM mortgage broker that arranges DSCR financing for real estate investors across 40 markets — 39 states plus Washington, D.C. Because these files are underwritten primarily on the property’s cash flow rather than a borrower’s personal income documentation, the structure tends to suit self-employed buyers and entity-owned portfolios particularly well, though review details remain subject to lender overlays. Lendmire places loans through wholesale investor lenders — it does not fund loans directly.
The firm has been recognized by Scotsman Guide as a 2025 Top Mortgage Workplace and a 2026 Top Mortgage Workplace.
Investment property review
See how the DSCR math works for Columbus, Ohio
Lendmire can review rent, leverage, property type, and DSCR fit before you get too far into the deal.
Informational only. Not a Loan Estimate, approval, or commitment to lend. Program availability and eligibility are subject to lender guidelines, credit approval, property review, and underwriting.
References
1. Homes.com — South Linden Multi-Family Listings
2. NeighborhoodScout — Linden, Columbus
4. Zillow Rental Manager Market
6. Central Ohio Hospital Council
7. The Lantern — Ohio State Extends Housing Agreement
8. Swiss Realty Group — Q2 2025 Multifamily Market Analysis
9. Intel Newsroom — Intel Invests in Ohio
10. City of New Albany — Amazon Investment Release
11. Scotsman Guide 2026 Top Mortgage Workplace
12. Scotsman Guide 2025 Top Mortgage Workplace
Brandon Miller
Founder & CEO, Mortgage Loan Originator, Lendmire LLC
- Mortgage Loan Originator · NMLS# 1129696 · Verify on NMLS Consumer Access
- North Carolina Real Estate Broker · License# 343312 · Verify on NCREC
- North Carolina Insurance Producer · License# 19053198 · Property, Casualty, Life, Health · Verify on NAIC SBS
- Lendmire LLC · Firm NMLS# 2371349 · Verify firm licensure
Required disclosures. Lendmire (NMLS# 2371349) operates as a licensed mortgage broker, not a direct lender or depository. The discussion in this article is general in nature and should not be relied upon as financial, legal, or tax advice — every investment scenario is unique and should be reviewed by a qualified professional. Any loan inquiry is subject to lender underwriting, and this article is not a commitment to lend or a guarantee of approval. Mortgage rates, loan terms, and program guidelines vary by borrower, property, and state, and may change without notice. Equal Housing Opportunity. Verify licensure at NMLS Consumer Access.