
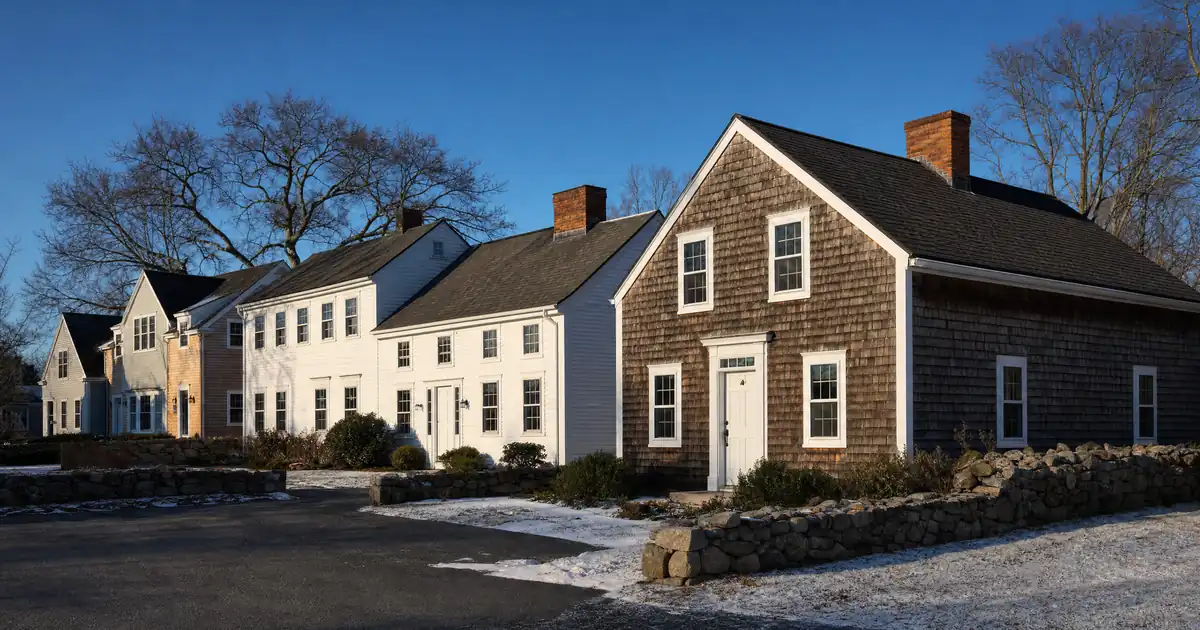
Stonington Borough has a median age of 63.1 — nearly one and a half times the regional average of 41.1 in the Norwich-New London-Willimantic metro — and a per capita income of $135,555, more than double the metro figure of $47,133. Population inside that historic waterfront village: 1,023 people. That is not a rental market. That is a retirement enclave with harbor views, and it sits inside the same town line as Pawcatuck, a workforce neighborhood renting to Electric Boat and Pfizer commuters for a fraction of the price. Understanding which of these two markets an investor is actually buying into is the whole ballgame in Stonington.
Key Takeaways: Investment property loans in Stonington, Connecticut are underwritten mainly on a property’s rental income measured against its full monthly carrying cost, and that structure favors buyers targeting Pawcatuck’s workforce rental stock, where average rent runs about $1,777 per NeighborhoodScout data, over Stonington Borough’s high-value second-home inventory.
DSCR Calculator
Run the numbers in your market
Rate source: Freddie Mac 30-yr average via FRED® — Federal Reserve Bank of St. Louis · effective Jul 30, 2026
Prefilled with starting assumptions — enter your own rent or nightly figures, taxes, insurance, and HOA for a more accurate picture.
Program parameters update from Lendmire’s centralized guideline source. Taxes and insurance are editable estimates.
As of Jul 30, 2026 · General Freddie Mac market benchmark, not a Lendmire loan offer. Rent, nightly rate, occupancy, taxes, and insurance are editable estimates. Short-term rental figures are estimates only and vary significantly by season, property type, management approach, and local short-term-rental rules — confirm local regulations before relying on them. Qualifying income for short-term rentals varies by program — some use appraisal market rent, others use documented STR history or projections — and is confirmed in underwriting. Not a Loan Estimate, approval, or commitment to lend. Program availability and eligibility are subject to lender guidelines, credit approval, property review, and underwriting.
- Pawcatuck rents average $1,777 monthly with 6.3 percent vacancy, per NeighborhoodScout.
- Multi-family in Stonington lists at a $812,000 median, versus $1.39 million for single-family townwide.
- Stonington Borough’s median home value tops $951,000 against roughly $1,550 median rent.
- Electric Boat plans to add 2,250 workers in Groton, on top of a shortfall of over 6,000 regional homes.
- Purchase financing tops out near 75 percent loan-to-value, with 1.00 DSCR as a floor most programs benchmark against.
Stonington Market Snapshot
A quick read on the Stonington investor landscape — figures come from the cited sources below. Confirm current property-level numbers before underwriting.
| Metric | Detail |
|---|---|
| Home prices | $831K median (Oct 2025) (Redfin Stonington Housing Market) |
| Typical rents | $1,777 avg (NeighborhoodScout) |
| Population | 18,478 population (Connecticut Demographics) |
| Employment | ~16,000 ct employees (CT.gov Office of Military) |
| Vacancy | 6.3% (NeighborhoodScout) |
One Town, Two Rental Markets
Stonington, Connecticut has roughly 18,478 residents and ranks 64th out of 169 municipalities in the state by population, per Connecticut demographic data — a modest, quiet coastal town on paper. But the town’s own major employers are small: Davis-Standard, a manufacturer; A Thyme To Cook; Alupower; the local school system; a Stop & Shop. None of those drive serious rental demand on their own.
The real tenant story sits just across the town line in Groton. General Dynamics Electric Boat employs roughly 16,000 people in Connecticut and posted full-year revenue up 17 percent to $16.7 billion, driven by Navy submarine production, according to a Connecticut Office of Military Affairs release. Next door, Naval Submarine Base New London occupies more than 680 acres, homeports 15 nuclear submarines, and hosts more than 70 tenant commands, per Naval History and Heritage Command records. A few miles further is the Pfizer Groton Research & Development site, 160 acres and 2.7 million square feet of lab space, employing more than 2,600 people according to a recent report. That’s the demand engine. Stonington’s job is to house the overflow.
And there’s real overflow to house. Groton needs more than 6,000 additional homes to accommodate rising Electric Boat and Sub Base staffing levels, and town officials there report that of Groton’s roughly 27,000 jobs, 82 percent of workers commute in from somewhere else, according to CT Mirror. Pawcatuck absorbs a meaningful share of that overflow. Stonington Borough, structurally, does not.
Why Pawcatuck Pencils
Pawcatuck is the strongest DSCR neighborhood in the town, and it isn’t close. Average rent there runs $1,777 monthly with vacancy at 6.3 percent — near the middle of the national range and well inside workable territory for a long-term hold, per NeighborhoodScout. Apartments.com’s CoStar-sourced local data breaks that down further: one-bedroom units averaging $1,375 and two-bedroom units at $1,733, with rents up 2.5 percent over the past year — modest, steady growth, not a bubble.
The tenant base backs this up. Pawcatuck households skew upper-middle income, ranking higher than 60 percent of American neighborhoods, with 37.1 percent of the working population in executive, management, and professional occupations — consistent with Electric Boat engineers, Pfizer staff, and commuters working the Rhode Island side of the line in nearby Westerly.
Institutional capital has already voted here. Stonington Village Apartments, a purpose-built rental community on Voluntown Road in Pawcatuck, is leasing luxury studio-through-three-bedroom units now, with an additional construction phase planned. That’s a developer betting real money on workforce rental demand concentrated in exactly this corridor — not in the Borough, not in Mystic.
Local zoning is moving the right direction too. Stonington’s Affordable Housing Plan, adopted by the town, specifically calls for removing regulatory friction around accessory dwelling units, duplexes, and multifamily housing, and floats allowing greater density on qualifying lots. Existing ADU rules already permit an attached unit by zoning permit on any single-family lot, with detached units available by special permit in certain cases — a real secondary-income lever for an investor holding a larger workforce lot in Pawcatuck, subject to verifying the current zoning specifics locally before underwriting one into the deal.
Skip the Borough for Rental Cash Flow
Stonington Borough is not a rental market — it’s a wealth-storage market, and treating it like the former is the single fastest way to overpay. Median house and condo value there runs $951,738, according to a recent city-data estimate, up sharply from $337,500 at the turn of the century. Median gross rent sits at just $1,550. Run those two numbers against each other on any reasonable purchase-money leverage and the math falls apart badly — modeled coverage on a median-priced Borough single-family, financed near 75 percent loan-to-value with full taxes and insurance factored in, lands well south of 0.30x. That isn’t a stretch scenario. That’s the baseline.
The demographic profile confirms it. Median household income in the Borough runs $109,167 with a poverty rate of just 5.14 percent, and per capita income sits at $135,555 — more than double both the regional metro figure and the statewide Connecticut average. Median age is 63.1. The housing stock itself is old, with a median construction year in the 1930s and roughly three-quarters of homes built before 1940. This is a buy-and-hold-for-appreciation, second-home, retiree market. Investors chasing rental yield here are fighting the fundamental character of the place.
Is Mystic a Buy or a Trap?
Mystic is genuinely hard to underwrite, and any investor who tells you the pricing is clean hasn’t pulled three different data sources. Redfin’s citywide pull recently showed a median sale price near $575,000, down 8.0 percent year over year; Redfin’s narrower “Downtown Mystic” polygon showed a similar price point but an even steeper 11.5 percent annual decline; an earlier Redfin snapshot using a different Mystic boundary put the median closer to $723,000, up 7.1 percent. Movoto’s own recent pull showed a $569,000 median list price with price-per-square-foot down 13 percent year over year. Rocket Homes put the median sold price at $513,500, up 3.3 percent. These aren’t contradictory because the market is unstable — they’re contradictory because every platform draws the Mystic boundary differently. That inconsistency alone should tell an investor to pull hyperlocal comps before pricing a Mystic deal, not a zip-level average.
On rent, Zillow puts the median across all bedroom counts at $1,995, ranging from $1,400 to $3,600 — a wide enough band to suggest Mystic rentals split between modest workforce units and premium tourist-adjacent product. U.S. News pegs the median home value lower, at $529,763, with median rent at $1,345. Either way, coverage math on Mystic single-family purchases is tight at best.
Flood exposure adds a real physical-risk layer on top of the pricing noise. Fifty-two percent of properties in Mystic carry severe flood risk over a 30-year horizon, and that figure climbs to 82 percent in Downtown Mystic specifically. Investors should budget for that reality and verify current flood-zone and insurance requirements with local professionals before committing — this is a genuine underwriting variable, not a footnote. This one’s a real toss-up: the tourism-driven upside is undeniable, but between the pricing noise and the flood exposure, Mystic rewards patient, well-capitalized buyers far more than leveraged cash-flow plays.
Multi-Family Beats Single-Family Here
The math is stark: multi-family properties in Stonington carry a median asking price around $812,000, while single-family homes townwide list at a median of $1.39 million, according to Redfin and Movoto data. That’s roughly a 40 percent entry-price gap in the same municipality, and it exists because combined unit rents offset the per-door price disadvantage that single-family carries in this market.
Existing multi-family stock clusters right at the seam between the Borough and Pawcatuck — walkable to the historic core, priced closer to workforce rents. Active listings have included a three-unit building with harbor and Watch Hill views, a four-unit property with efficiency units on the ground floor and a larger furnished unit above, and a two-unit property marketed specifically as bridging Borough charm with Pawcatuck’s rental economics. That geographic overlap is where an investor should be hunting — not competing for scarce, overpriced Borough single-family stock, and not overpaying for Mystic waterfront exposure.
Running the Numbers on a Pawcatuck Duplex
Consider a hypothetical Pawcatuck duplex priced around $420,000 — a modeled figure for illustration, not a specific listing — combining a one-bedroom unit renting near $1,375 and a two-bedroom near $1,733, both figures drawn from Apartments.com’s Pawcatuck rent data. Combined monthly rent runs roughly $3,108. Financed at 75 percent loan-to-value with 25 percent down, and modeling full principal, interest, property taxes, and insurance — not principal and interest alone — that scenario lands around a low-1.10x coverage ratio. That clears most standard DSCR programs’ 1.00 floor with some room, though the margin is real but not generous, and a soft month of vacancy or a jump in insurance could compress it toward the line.
Compare that to a median-priced Borough single-family at $951,738 renting near $1,550: modeled coverage on the same leverage and cost assumptions falls to a small fraction of 1.00x — nowhere close to qualifying territory on rental income alone. The contrast is the whole thesis of this market in one comparison.
Purchase financing on Lendmire’s DSCR programs typically tops out near 75 percent loan-to-value, with credit tiers generally starting around 620 and improving pricing available at 660, 680, and 700, and reserve requirements generally running about six months of PITIA (closer to nine months on loans above $1.5 million) — all subject to lender guidelines, property review, and program eligibility. This breakdown of “What Is a DSCR Loan” covers the mechanics if this is new territory; the short version is that rent gets measured against the full monthly obligation, not personal income, which is exactly why Pawcatuck and the Borough produce such different outcomes on paper even though they’re in the same town.
DSCR files in markets with this kind of internal bifurcation — a wealthy micro-village sitting inside an otherwise workforce-driven town — tend to show a common friction point at the deal desk: the appraisal comp set. Pulling comps from the wrong sub-neighborhood inflates or deflates the rental income assumption before the file ever reaches underwriting, so getting hyperlocal comps locked in early tends to separate the clean files from the ones that bounce back for revision.
Does 13 Percent Vacancy Mean Oversupply?
No — not in the way a lender or investor typically means it, and conflating the two is a real analytical mistake here. NeighborhoodScout reports 13.01 percent of Stonington’s housing stock is classified as vacant townwide, a figure the source itself notes can be a drag on pricing when unabsorbed. But that number is almost certainly weighted by the Borough’s second-home and seasonal-resident character — a population with a median age of 63.1 and per capita income double the regional average does not behave like a rental-vacancy problem. Pawcatuck’s own vacancy rate, by contrast, runs a much tighter 6.3 percent — the actual figure that matters for a workforce-rental DSCR hold. Reading the townwide 13 percent as rental oversupply and walking away from Pawcatuck because of it would be a mistake; the two numbers describe entirely different phenomena.
The town’s fiscal position, meanwhile, is genuinely strong background context: Stonington’s net grand list has grown 27.6 percent over the past decade to roughly $4.04 billion, the tax base remains 75.1 percent residential, and the town carries an AAA/Aa1 bond rating with debt per capita of $4,461 — below the state average, per the town’s own Plan of Conservation & Development. That’s a municipality with room to keep investing in infrastructure and services, which matters for long-run tenant demand even if it doesn’t move a DSCR ratio directly.
For an equity-build angle down the line, one recent sold comp is instructive without overreaching: a Stonington property sold for $569,000 and carried a current estimated value of $597,689 roughly a year later — call it a 5 percent gain, a realistic seasoning benchmark rather than the double-digit appreciation seen in some faster-moving markets. That’s context worth keeping in mind for anyone planning an eventual cash-out move, though the mechanics of that belong to a separate conversation.
DSCR vs. conventional financing
Two common ways to finance an investment property in Stonington, CT. They qualify you differently — here’s how investors weigh them.
Why investors choose it
- Qualifies on the property’s rental income — no personal tax returns, W-2s, or pay stubs needed to document income.
- No personal debt-to-income ceiling to clear, so existing mortgages and obligations don’t cap your borrowing the same way.
- Can be closed in an LLC, keeping the property inside a business entity.
- Built for scaling — not held to the limit on number of financed properties that conventional financing applies.
- Underwriting centers on the deal: generally qualifies when the rent covers the payment, a 1.00x coverage ratio being a common baseline (confirmed in underwriting).
- Designed specifically for investment property, including long-term and, where the program allows, short-term rentals.
Where it’s strong
- Often the lowest ongoing financing cost for a buyer who fully qualifies on personal income — a fit for a first property or a cost-first purchase.
Trade-offs for investors
- Requires full personal income documentation and must fit within a debt-to-income limit — salary, existing debts, and other mortgages all count.
- Typically held in your personal name rather than a business entity.
- Caps how many financed properties you can carry, which can become a ceiling as a portfolio grows.
- Evaluates you as a borrower as much as the property, which usually means more paperwork.
How investors usually choose: a first or single property often optimizes for the lowest financing cost; portfolio builders often optimize for leverage, vesting in an LLC, and scaling past conventional caps. The right answer depends on your goals, the property, and current guidelines — both paths run through select lenders in Lendmire’s wholesale network, with eligibility and terms confirmed in underwriting.
Lendmire’s Connecticut DSCR platform covers purchase and cash-out scenarios statewide, and investors working a Pawcatuck or Borough deal can talk through the numbers directly or reach the team at 828-256-2183. For a broader sense of how rental-income-based underwriting stacks up against a standard mortgage, Lendmire’s DSCR-versus-conventional breakdown walks through the structural differences.
Frequently Asked Questions
How do you qualify for a DSCR loan in Stonington, Connecticut?
Qualification centers on the subject property’s rental income measured against its full monthly carrying cost, rather than the borrower’s personal income documentation. Purchase financing on Lendmire’s programs typically tops out near 75 percent loan-to-value, credit tiers generally start around 620 with better pricing available at 660, 680, and 700, and reserves generally run about six months of PITIA — closer to nine months on loans above $1.5 million — all subject to lender guidelines and property review. Because Pawcatuck’s rent-to-price ratio and Stonington Borough’s differ so sharply, the neighborhood chosen inside the town line has a real effect on whether a file clears comfortably or not.
What credit score do you need for a DSCR loan in Stonington?
Programs generally start around a 620 minimum, with improved terms available at 660, 680, and 700 credit tiers, subject to lender guidelines and overall file strength. Reserves, leverage, and the property’s coverage ratio all factor into the final terms alongside credit.
Can you get DSCR financing for a rental property in Pawcatuck?
Yes — Pawcatuck’s rent levels relative to purchase price tend to produce workable coverage ratios more consistently than Stonington Borough, given the neighborhood’s workforce tenant base tied to nearby Electric Boat and Pfizer employment. Each file is still evaluated individually against rent, leverage, and full carrying costs.
Does Stonington Borough’s high property value make DSCR qualifying harder?
Generally, yes. Because median rent in the Borough sits well below what a property at that price point would need to generate for full coverage, rental income alone typically falls short of the coverage ratios most DSCR programs look for there. Multi-family properties near the Borough/Pawcatuck seam, or Pawcatuck rentals directly, tend to model more favorably than Borough single-family purchases.
What DSCR ratio is required for an investment loan in Connecticut?
A 1.00 ratio functions as a floor on select programs, meaning rental income roughly matches the full monthly obligation, though many lenders look for a stronger cushion above that floor depending on the program, leverage, and property type. Qualifying details vary by lender and should be confirmed directly before locking in a purchase strategy.
About Lendmire
Lendmire (NMLS# 2371349) is a mortgage brokerage built around DSCR investor financing, arranging programs through wholesale and investor-lending channels across a 41-market footprint that spans 40 states plus Washington, D.C. Loans are evaluated by the lender on the property’s cash flow rather than the borrower’s personal income, subject to lender guidelines, with support for LLC closings and portfolio investors holding multiple financed properties. Scotsman Guide recognized the firm as a top-ranked workplace in 2025 and again as a top-ranked workplace in 2026.
The single biggest blind spot for a DSCR-financed investor in Stonington isn’t the coverage math — it’s mistaking a townwide statistic for a neighborhood truth. Every figure the market produces, from vacancy to median price to appreciation, gets distorted by blending a 1,023-person retiree enclave with a workforce commuter suburb inside the same reporting boundary. Pull the wrong comp set, and the numbers will lie convincingly in either direction.
For broader investor-financing rules and property-type coverage across the state, see Connecticut DSCR loans.
Get Started
Ready to find the right loan for you?
In about 30 seconds you can review financing options available for your investment property. No commitment required.
Informational only. Not a Loan Estimate, approval, or commitment to lend. Program availability and eligibility are subject to lender guidelines, credit approval, property review, and underwriting.
References
1. NeighborhoodScout — Pawcatuck, Stonington CT
2. Redfin Stonington Housing Market
5. Naval Submarine Base New London
6. Pfizer Groton, Connecticut Research Site
7. CT Mirror — Groton housing shortage
8. Zillow Rental Manager Market Trends — Mystic CT
9. Scotsman Guide — Top Workplaces 2025
10. Scotsman Guide — Top Workplaces 2026
This article is part of Lendmire’s DSCR loan program — full qualification details, guidelines, and scenarios live on the program page.
Related reading: DSCR Investment Property Loans in Mystic, CT: How Investors Qualify in Mystic · Super Jumbo DSCR Loans In Connecticut: Complete Guide · DSCR Portfolio Loans In Connecticut: Several Rentals, One Note
Guides: DSCR Loans in Connecticut
Brandon Miller
Founder & CEO, Mortgage Loan Originator, Lendmire LLC
- Mortgage Loan Originator · NMLS# 1129696 · Verify on NMLS Consumer Access
- North Carolina Real Estate Broker · License# 343312 · Verify on NCREC
- North Carolina Insurance Producer · License# 19053198 · Property, Casualty, Life, Health · Verify on NAIC SBS
- Lendmire LLC · Firm NMLS# 2371349 · Verify firm licensure
Compliance and disclosures. Lendmire (NMLS# 2371349) is a licensed mortgage broker and is not a direct lender, depository institution, financial advisor, or tax professional. Content in this article is general market analysis and educational information — not financial, legal, or tax advice for any specific situation. Lendmire does not guarantee loan approval; every transaction is subject to underwriting by the funding lender. Mortgage pricing and loan program guidelines are subject to change at any time without notice and vary by borrower characteristics, property type, and state regulations. Lendmire complies with Equal Housing Opportunity. Licensure verification: NMLS Consumer Access.