
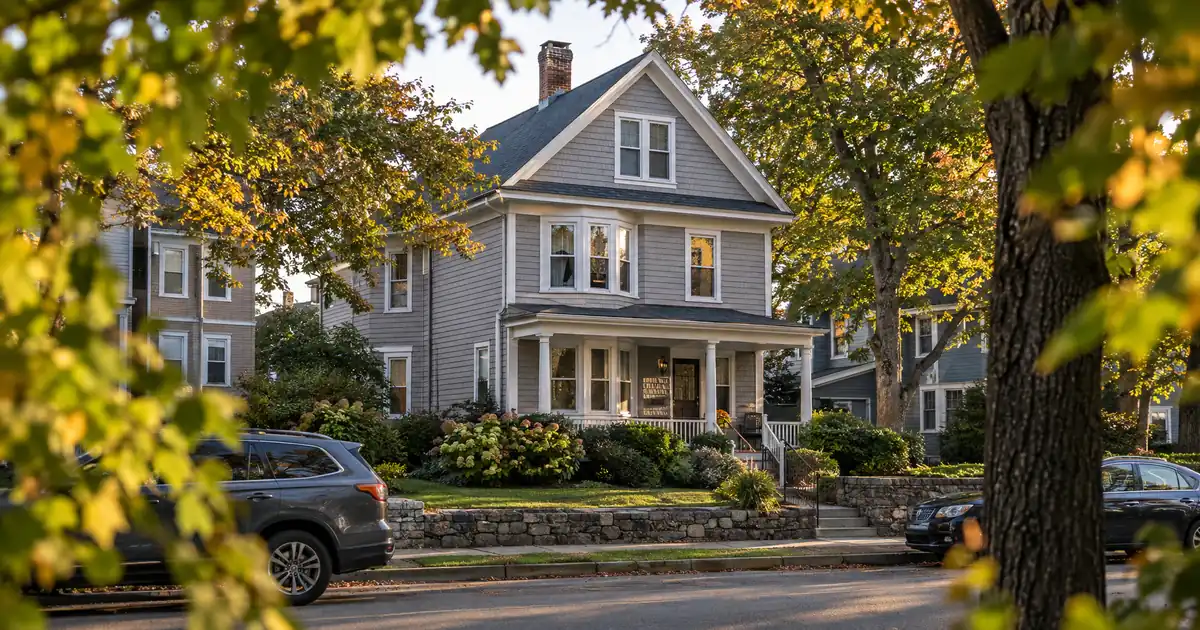
Picture an investor in Texas or Florida scrolling Peabody listings. The city median sale price sits at $677,161, down 2.1 percent year over year. The rent comps look strong, and the city is 15 miles from Boston. What that investor usually misses is that prices here are flat to soft, so a cash-out refinance can’t lean on appreciation. Proceeds come from the discount you bought at, the renovation you finished, or the rent you reset, all tested against a 75 percent LTV ceiling. This article covers extracting equity from a Peabody property already owned. Purchase mechanics are a different piece.
DSCR Cash-Out Calculator
Run the cash-out numbers in Peabody, MA
Rate source: Freddie Mac 30-yr average via FRED® — Federal Reserve Bank of St. Louis · effective Sep 24, 2026
Prefilled with starting assumptions — enter your property’s value, balance, taxes, and insurance for a more accurate picture.
Program parameters update from Lendmire’s centralized guideline source. Taxes and insurance are editable estimates.
As of Sep 24, 2026 · General Freddie Mac market benchmark, not a Lendmire loan offer. Property value, balance, taxes, and insurance are editable estimates. Maximum loan-to-value varies by lender, program, property type, and seasoning. Not a Loan Estimate, approval, or commitment to lend. Program availability and eligibility are subject to lender guidelines, credit approval, property review, and underwriting.
The Quick Read:
Cash-out refinancing in Peabody, Massachusetts suits investors who already own a stacked two- or three-family and can document market-level rents. The loan is underwritten primarily on the property’s rental income measured against its full monthly obligation, with a city median sale price of $677,161 shaping the math.
- Cash-out LTV tops out at 75 percent, and about six months of ownership is typical before it opens.
- Two- and three-family buildings carry coverage. West Peabody single-family homes often land below 1.00.
- Price trends are flat to soft, so appraisal risk matters more than appreciation.
- Reserves of about six months PITIA are typical, higher on larger balances.
Peabody Market Snapshot
A quick read on the Peabody investor landscape — figures come from the cited sources below. Confirm current property-level numbers before underwriting.
| Metric | Detail |
|---|---|
| Home prices | $849K median across 8 listings (Redfin, multi-family Peabody) |
| Typical rents | $2,059 (City-Data) |
| Population | 54,695 population (Census Reporter) |
Why Stacked Units Beat Detached Houses Here
Two- and three-family buildings are the DSCR product in Peabody. Detached houses cost more per rentable unit, and the Census-derived means show it. City-Data puts mean values at $518,352 for two-unit structures and $520,482 for three-to-four-unit structures, against $723,864 for detached homes. Those are survey means, not current sale prices, but the gap is real: two or three doors for less than the price of one detached house.
Rents point the same way. Zumper puts the average Peabody house at $3,950 a month against a $677,161 median sale price. That is a gross yield near 7 percent. Two 2-bedroom units at Zumper’s $2,927 average gross a bit over 8 percent of an $849,000 multi-family listing price (Redfin). Those are screening ratios, not underwriting, and property-level expenses decide the real number.
The tenant base explains the demand. About 34 percent of households rent, per RentCafe. Health care and social assistance is the largest resident-worker sector at 4,710 people, then retail at 2,967 and manufacturing at 2,504, per Data USA. About 26.9 percent of workers live and work in the city, and the daytime population drops 8.3 percent from commuting. Peabody is largely a bedroom market for the Route 128 and I-95 corridor. Tenants are working households and commuters, not students.
Town Center: Where the Math Works (With a Catch)
Town Center is the Peabody submarket where appraisal risk is highest. It has the lowest entry price and the lowest rent. Homes.com shows a median sale price of $525,000, down 7 percent, and multi-family stock turning over in about 16 days. Zumper calls it the most affordable area at roughly $2,000 a month.
Run the numbers on a Town Center two-family at a conservative valuation, with each unit modeled at the Census median gross rent. At 75 percent LTV, with the payment modeled on full PITIA including Massachusetts property taxes and insurance, coverage comes out well under 1.0x, in a band of roughly 0.62x to 0.67x depending on where rates fall within the modeled range. That sits below the 1.00 floor some select programs use, so a deal like this would not clear on rent alone. It would likely need a lower loan amount, more cash down, or a different program, and it remains subject to lender guidelines.
Now the catch. Redfin’s Town Center data showed a median sale price down 19.1 percent year over year in one snapshot. Small samples swing hard, but an appraiser sees that same tape. Don’t count on a generous valuation. Build your cash-out plan on a conservative value and treat anything above it as a bonus.
Downtown also carries mixed-use buildings, such as commercial ground floors with apartments above. A six-unit building with two commercial units is not the same file as a three-family. Some lenders won’t touch it under a residential DSCR program, so confirm fit before you plan an exit around it.
West Peabody Single-Family: Skip It for Cash-Out
West Peabody is a fine place to own. It’s a middle-to-upper-income residential area near Northshore Mall and Route 128, with a median sale price around $760,000, down 1.1 percent. It is a poor cash-out candidate.
Take a $760,000 house rented at Zumper’s $3,950 house average. At 75 percent LTV, with taxes and insurance in the payment, coverage falls in the low 0.8s. That is sub-1.00. A sub-1.00 program, an interest-only structure, or lower leverage might be reviewed by select lenders, but the file gets harder: stronger credit, more reserves, and less cash out. Qualification stays subject to lender guidelines, credit approval, and property review.
Honestly, a single-family investor here often does better refinancing at a lower LTV to keep the property, rather than forcing a maximum cash-out on math that doesn’t support it. The exception is a house with a legal accessory setup already producing separate rent. Otherwise, the capital is better deployed in stacked units elsewhere in the city.
How Do the Rents Actually Compare?
Peabody rent sources disagree, and that matters for your appraisal and your coverage ratio.
| Source | Figure |
|---|---|
| Census median gross rent | $2,059 |
| Apartment List median | $2,137, down 1.4% |
| Zumper average | $2,496, up 3% |
| RentCafe (50+ unit buildings) | $2,755 average |
The spread is method, not noise. RentCafe’s data covers only buildings with 50 or more units, and named communities such as Alexan Peabody price like new construction. An older three-family in Town Center or South Peabody will not rent at those levels. Underwrite toward the lower sources, and treat anything above them as upside you have to prove with a lease.
For South Peabody, Zumper shows about $2,259 a month, and Proctor about $2,897. I found no price data for either, so a rent-to-value read isn’t possible. Treat both as candidates to price out yourself.
What the Experience Looks Like on the Ground
DSCR files in markets like this one typically look like a tension between rent-reset upside and a soft appraisal. Investors who bought older two- and three-families with long-term tenants often carry below-market rents, and the refinance is where those rents get tested against market. The files that go smoothly usually have leases, a rent comp set drawn from similar small buildings rather than large complexes, and reserves documented before the file goes to a lender. The files that stall are usually the ones where the investor assumed a valuation before the appraisal came back.
Seasoning and Comps: What Helps and What Doesn’t
Cash-out typically needs about six months of ownership measured from title recording. That clock matters more here than in a fast-appreciating market, because you can’t wait out a bad value. If you buy in the middle of a flat stretch, the value you refinance on is close to the value you paid, plus whatever you improved.
Liquidity is a real positive. Homes.com reports multi-family listings averaging 18 days before sale, with active listings ranging from $750,000 to $2,750,000. Fast-turning stock gives appraisers recent comps. But multi-family sales are far fewer than single-family sales, so the comp set for a two- to four-unit building can be thin. A thin set means outcomes vary. Budget conservatively.
There is a “below-market rent” trap worth naming. Some listings advertise long-term tenants paying under market as a selling point. That’s a rent-reset path, but a lender may weigh in-place rent versus market rent differently. Confirm that treatment before you count on a market-rent qualification.
Cash-Out Parameters Worth Knowing
Lendmire, a DSCR-focused mortgage broker, arranges these loans through wholesale investor lenders. Typical guidelines on most files are a 75 percent LTV ceiling on cash-out, a 1.00 minimum coverage ratio, and credit tiers starting at a 620 floor. Reserves are typically about six months PITIA, rising to about nine months above $1,500,000. Standard programs run up to $3,000,000, and smaller balances route through select lenders. Program details change, so confirm current terms before structuring a refinance. Loans to LLC-titled borrowers are subject to program terms.
The DSCR ratio itself is monthly rent divided by the full monthly obligation, including principal, interest, taxes, insurance, and any HOA dues. The mechanics of the ratio and how it differs from conventional underwriting are covered in more depth elsewhere. For the refinance side, read the guide “The Refi Options”. Massachusetts DSCR financing covers the state hub.
Proceeds are not a guaranteed figure. Available equity depends on rent used for lender review, PITIA, reserves, and the 75 percent ceiling all at once. Manufactured homes, log homes, and barndominiums fall outside these programs.
Where Peabody’s Cost Structure Helps
One local edge is easy to overlook. Peabody Municipal Light Plant is a city-owned utility serving about 26,000 customers, per PMLP. FindEnergy shows residential electric costs well below the Massachusetts average. Salem next door is served by National Grid. Lower utility costs help tenant affordability in a high-rent market and trim landlord-paid electric expenses where you carry them. Municipal utilities exist elsewhere in Massachusetts, so call this uncommon rather than unique. It’s a tie-breaker, not a thesis.
Employment anchors are diversified rather than concentrated. Lahey Clinic, Peabody operates a hospital with a 24-hour emergency department. Northshore Mall is described as the city’s largest employer and taxpayer in a regional profile. The city is one of 26 state-designated Gateway Cities, per the North Shore Alliance for Economic Development. No headcount data was available, so treat these as qualitative demand support. Verify current local rental rules, taxes, and insurance with qualified local professionals before underwriting.
The Deploy-the-Proceeds Question
Cash-out only makes sense if the next deal outperforms the debt on the one you’re refinancing. A stacked Peabody building refinanced near 1.2x coverage and redeployed into a similar building elsewhere doubles your exposure to a flat-price market. A single-family refinanced into a sub-1.00 file gives up cash flow you already have. This one’s a genuine judgment call, and the answer flips depending on whether you’re buying below value or paying full price.
The cleaner play is often a value-add: a Town Center two-family bought at a discount, rehabbed, rents reset, then refinanced after seasoning. The equity comes from the work, not the market.
Peabody’s Equity Play in One Paragraph
Peabody rewards owners who created their equity instead of waiting for it. Stacked units in the older core carry the coverage, single-family in West Peabody generally does not, and a soft appraisal is the risk that decides the rest. The investors who buy below value, reset rents, and refinance on a conservative valuation will come out ahead.
DSCR vs. conventional financing
Two common ways to finance an investment property in Peabody, MA. They qualify you differently — here’s how investors weigh them.
Why investors choose it
- Qualifies on the property’s rental income — no personal tax returns, W-2s, or pay stubs needed to document income.
- No personal debt-to-income ceiling to clear, so existing mortgages and obligations don’t cap your borrowing the same way.
- Can be closed in an LLC, keeping the property inside a business entity.
- Built for scaling — not held to the limit on number of financed properties that conventional financing applies.
- Underwriting centers on the deal: generally qualifies when the rent covers the payment, a 1.00x coverage ratio being a common baseline (confirmed in underwriting).
- Designed specifically for investment property, including long-term and, where the program allows, short-term rentals.
Where it’s strong
- Often the lowest ongoing financing cost for a buyer who fully qualifies on personal income — a fit for a first property or a cost-first purchase.
Trade-offs for investors
- Requires full personal income documentation and must fit within a debt-to-income limit — salary, existing debts, and other mortgages all count.
- Typically held in your personal name rather than a business entity.
- Caps how many financed properties you can carry, which can become a ceiling as a portfolio grows.
- Evaluates you as a borrower as much as the property, which usually means more paperwork.
How investors usually choose: a first or single property often optimizes for the lowest financing cost; portfolio builders often optimize for leverage, vesting in an LLC, and scaling past conventional caps. The right answer depends on your goals, the property, and current guidelines — both paths run through select lenders in Lendmire’s wholesale network, with eligibility and terms confirmed in underwriting.
Frequently Asked Questions
How do you qualify for a DSCR cash-out refinance in Peabody, Massachusetts?
The file is built around the property’s rent versus its full monthly obligation, with 1.00 the standard baseline. Typical guidelines include a 620 credit floor, about six months of ownership, and about six months PITIA in reserves, all subject to lender guidelines and property review. A Peabody two- or three-family with documented rents tends to fit more naturally than a single-family house.
What are the requirements for an investment property loan in Peabody, Massachusetts?
Expect a property appraisal, rent documentation such as leases or a rent schedule, proof of reserves, and a credit review. Cash-out tops out at 75 percent LTV. Loan sizes run up to $3,000,000 on standard programs. Requirements vary by borrower, property, and program.
Can a West Peabody single-family house support a cash-out refinance?
Often not at full leverage. At a roughly $760,000 median price and Zumper’s $3,950 house rent, coverage modeled with taxes and insurance falls below 1.00. Select lenders may review sub-1.00 scenarios with lower leverage, stronger credit, or interest-only structures, but the file gets harder.
What down-payment ranges may DSCR lenders review for Peabody investment-property purchases?
Will flat prices in Peabody limit how much cash I can pull out?
Yes. With Redfin showing the city median down 2.1 percent and Zillow showing a gain of 0.7 percent, proceeds depend on the appraisal, not on assumed growth. Plan around purchase discount or renovation value. Town Center is the most volatile, so budget a conservative value.
For current guidelines and terms, see Lendmire’s DSCR loan programs page.
About Lendmire
Lendmire (NMLS# 2371349) is a non-QM mortgage broker serving investors in 41 markets including Washington, D.C. It helps structure DSCR scenarios commonly evaluated on a property’s rental income rather than personal income paperwork, subject to lender guidelines. The brokerage was recognized by Scotsman Guide as a 2026 Top Workplace and recognized by Scotsman Guide in 2025. It places loans through wholesale investor lenders and is not a direct lender. Investors can get a DSCR quote or call 828-256-2183.
Get Started
Ready to find the right loan for you?
In about 30 seconds you can review financing options available for your investment property. No commitment required.
Informational only. Not a Loan Estimate, approval, or commitment to lend. Program availability and eligibility are subject to lender guidelines, credit approval, property review, and underwriting.
References
2. Redfin
5. Zumper, Peabody rent research
6. RentCafe
8. Homes.com
10. Redfin — West Peabody Housing Market
11. Homes.com, Peabody multi-family
12. PMLP
13. FindEnergy
15. businessinfocusmagazine.com — Nobody Does It Quite Like Peabody
16. North Shore Alliance for Economic Development
17. recognized by Scotsman Guide as a 2026 Top Workplace
18. recognized by Scotsman Guide in 2025
This article is part of Lendmire’s investment property cash-out refinance program — full qualification details, guidelines, and scenarios live on the program page.
Related reading: DSCR Cash Out Refinance Peabody Massachusetts · Cash Out Refinance Investment Property Pittsfield Massachusetts · DSCR Cash Out Refinance Weymouth Massachusetts
Guides: Investment Property Cash-Out Refinance in Peabody, MA · Investment Property Cash-Out Refinance in Massachusetts
Brandon Miller
Founder & CEO, Mortgage Loan Originator, Lendmire LLC
- Mortgage Loan Originator · NMLS# 1129696 · Verify on NMLS Consumer Access
- North Carolina Real Estate Broker · License# 343312 · Verify on NCREC
- North Carolina Insurance Producer · License# 19053198 · Property, Casualty, Life, Health · Verify on NAIC SBS
- Lendmire LLC · Firm NMLS# 2371349 · Verify firm licensure
Disclosure information. Lendmire is a state-licensed mortgage brokerage under NMLS# 2371349. Lendmire is not a depository institution, direct lender, or financial advisor — all loans referenced are placed through wholesale lender partners and are subject to each lender's underwriting standards. This article is provided for general informational purposes and is not a commitment to lend, nor does it constitute financial, legal, or tax advice. Loan programs, terms, rates, and qualification standards change without notice and depend on borrower profile, property type, and the state in which the subject property is located. Equal Housing Opportunity provider. NMLS Consumer Access: nmlsconsumeraccess.org.