
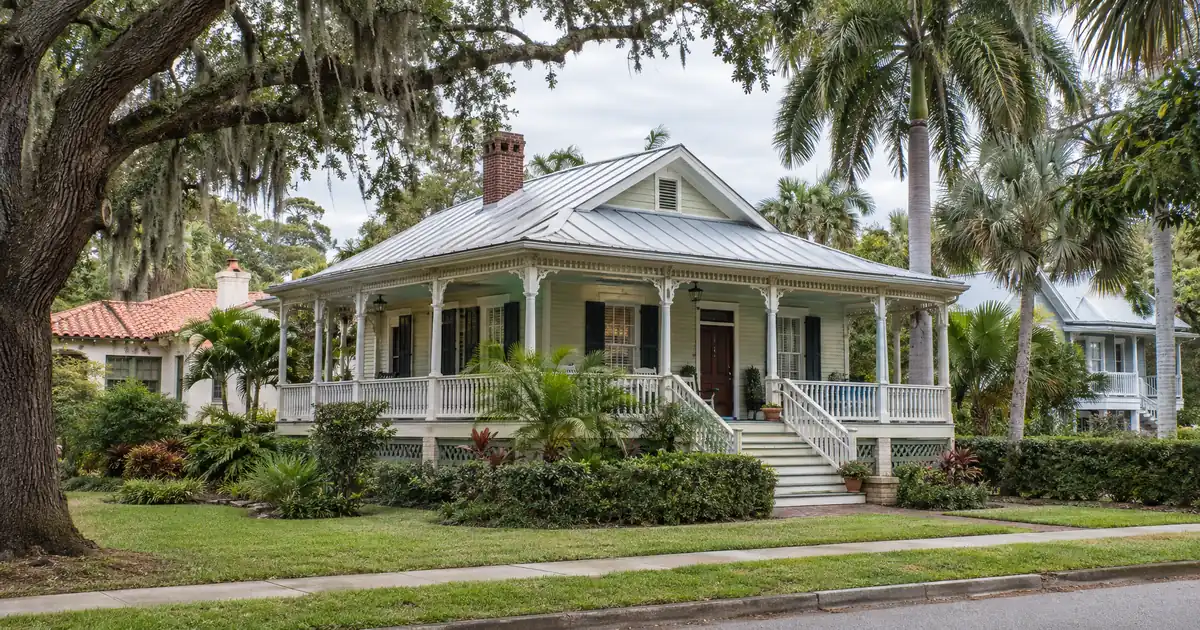
Carol City is the deepest pool of rental houses in Miami Gardens, and the pricing inside it is wider than most owners expect. Homes.com shows a neighborhood median near $550,000, while townhouses in the same neighborhood list between $335,000 and $424,900. That spread is the cash-out story in miniature. The same rent roll supports very different loan sizes depending on what you own and what an appraiser can defend.
This piece is for owners who already hold a rental here. The question isn’t what to buy but how much equity the file will release, and whether the coverage ratio survives the 75 percent LTV ceiling.
DSCR Cash-Out Calculator
Run the cash-out numbers in Miami Gardens, FL
Rate source: Freddie Mac 30-yr average via FRED® — Federal Reserve Bank of St. Louis · effective Sep 24, 2026
Prefilled with starting assumptions — enter your property’s value, balance, taxes, and insurance for a more accurate picture.
Program parameters update from Lendmire’s centralized guideline source. Taxes and insurance are editable estimates.
As of Sep 24, 2026 · General Freddie Mac market benchmark, not a Lendmire loan offer. Property value, balance, taxes, and insurance are editable estimates. Maximum loan-to-value varies by lender, program, property type, and seasoning. Not a Loan Estimate, approval, or commitment to lend. Program availability and eligibility are subject to lender guidelines, credit approval, property review, and underwriting.
The Quick Read: A DSCR cash-out refinance on a Miami Gardens, Florida rental is underwritten primarily on the property’s rental income measured against its full monthly obligation, with leverage capped at 75 percent of appraised value, about six months of title seasoning, and reserves behind the file, all subject to lender guidelines.
- Rentcast puts 3BR rent in ZIP 33169 near $3,170, against a $459K citywide median sale price.
- Sale prices are flat while days on market stretched from 45 to 81, so appraisals hinge on sold comps.
- Modeled coverage on a median-priced 3BR lands in the low 1.0s, including taxes and insurance.
- Carol City at its median price models under 1.00. Norland and Bunche Park pencil better.
- Multi-unit stock is thin, so expect single-family comps.
Miami Gardens Market Snapshot
A quick read on the Miami Gardens investor landscape — figures come from the cited sources below. Confirm current property-level numbers before underwriting.
| Metric | Detail |
|---|---|
| Home prices | $465,000 median value (City of Miami Gardens) |
| Recent appreciation | +8.5% yoy (Zillow Home Values) |
| University enrollment | 5,000+ st. thomas students (City of Miami Gardens, Economic) |
| Employment | 5,553 logistics jobs (City of Miami Gardens, Economic) |
| Vacancy | 4.7% (NeighborhoodScout Norland) |
Appraisal Value Is the Whole Game
Cash-out proceeds are set by appraised value times 75 percent, minus your payoff. Everything else is secondary. In Miami Gardens the value signal is mixed, so it matters which number the appraiser will actually use.
Zillow’s home value index sits at $432,497, up 8.5 percent over the past year, with homes going pending in about nine days. That is an index, not a sale price. Redfin reports a median sale price of $459K, up just 1.1 percent, with price per square foot at $320 (down 6.8 percent) and homes averaging 81 days on market versus 45 the year before. Zillow’s index runs lower than Redfin’s sale median because the two measure different things.
Read those together and you get a market that ran hard, then cooled. Appraisers price off closed sales. An owner underwriting against the Zillow appreciation headline will be disappointed; an owner underwriting against Redfin’s flat sold-price data won’t be. At the ZIP level, Momentum Realty shows a typical value of $482,300 in ZIP 33056 with about 8.2 percent annual growth over five years. Long-hold owners still carry meaningful embedded equity, and that is what a cash-out taps. Recent buyers at peak prices may find the 75 percent cap leaves little room.
Not a hot appreciation market. A market where the equity was built earlier.
The Coverage Math at 75 Percent
Coverage is monthly rent divided by full PITIA. Run the numbers on a Norland house appraising at Redfin’s $464,794 neighborhood median, renting at the Rentcast 3BR median of $3,170. These are modeled assumptions, not a quote: 75 percent LTV, a 30-year fixed, taxes and insurance at Florida averages. Coverage lands around 1.05, including taxes and insurance. A 4BR at Rentcast’s $3,410 median moves that toward 1.10 to 1.15.
Now the same 3BR rent on a Carol City house at the $550,000 neighborhood median. Coverage models around 0.85 to 0.90. Sub-1.00 on long-term rent alone.
That doesn’t end the conversation, but it changes it. Select lenders may review sub-1.00 files with lower leverage, stronger credit, and deeper reserves. An interest-only structure can also reshape the ratio. Each comes with tradeoffs in proceeds, and qualification stays subject to lender guidelines, credit review, and the property itself. For Carol City owners, the honest read is that the median-priced house carries a lot of value but thin rental coverage. Townhouses at the lower end of the neighborhood range may pencil better than the detached stock.
Rent data supports caution on growth assumptions. Apartments.com shows 3BR rents around $3,017 with rents down 1.9 percent year over year, and the Rentcast ZIP 33169 average of $2,280 was down 5.8 percent. Current Zillow listings show 3-bed, 2-bath houses asking $3,365 and $3,660, plus a 3-bed, 1-bath at $2,180. Those are asking rents on single listings, not medians. Underwrite the median, not the ask.
The rough gross rent-to-price on that $3,170 3BR against the $459K median is about 8.3 percent. That mixes two sources, so treat it as an illustration. It shows why the ratio clears 1.00 by a small margin instead of a comfortable one. For a walk through the ratio itself, see the guide “What Is a DSCR Loan”.
Norland and Opa-locka North: Demand Meets Older Stock
Norland is the strongest cash-out candidate in the data. NeighborhoodScout describes mostly medium-to-large single-family homes plus small apartment buildings, many built between 1940 and 1969, with real estate vacancy of 4.7 percent. Larger footprints matter here: the Rentcast jump from $2,090 on a 2BR to $3,170 on a 3BR says the per-door income is in the bigger houses. My inference, but the pattern is consistent.
The demand story is Florida Memorial University, which reported record enrollment of 2,556 students. Sounds like a rental tailwind. Here’s the catch: Hoodline reports the record arrived alongside an accreditation probation and a financial-risk ranking, and the increase comes off a base near 1,100 students per the university’s earlier release. Treat it as upside, never as the base-case tenant pool. St. Thomas University, with more than 5,000 students per the City’s economic page, and its law school add a steadier if modest layer of shared-rental demand.
Opa-locka North is the weaker sibling. Redfin has the median near $490K, down 2.0 percent, with 78 days on market versus 46 a year earlier. It also flags substantial long-term flood exposure there. Softer comps and a heavier carrying-cost profile don’t help a 75 percent LTV file. Owners there should expect appraisal friction.
| Submarket | Median | Signal |
|---|---|---|
| Carol City | $550,000 | Deepest volume, thin coverage |
| Norland | $464,794 | Down 3.1 percent, best 3BR fit |
| Opa-locka North | $490K | Down 2.0 percent, slower sales |
Bunche Park: Best Math, Thinnest Data
Bunche Park is the lowest-priced submarket in the research, well below the city median. Entry price against the same citywide rent bands gives it the strongest modeled coverage in Miami Gardens by a wide margin, comfortably above the Norland numbers.
The problem is sample size. Sales volume is small, which means an appraiser has few comps to lean on, and a thin comp set cuts both ways at the 75 percent ceiling. One low appraisal can erase the cash-out. Thinking out loud here: the neighborhood offers the best ratio and the least certainty, and owners with a long hold and documented improvements are better positioned than anyone counting on the Bunche Park price to rise into the loan.
Skip the Stadium Premium
Hard Rock Stadium is the city’s identity, and WLRN reported that the seven World Cup matches were expected to generate more than $650 million in direct economic activity. That is a spending event, mostly hotels, restaurants, and retail, and it’s over. Don’t put it into stabilized rent assumptions.
The durable part is workforce employment. Indeed lists 414 stadium openings, and ZipRecruiter puts most of those roles at roughly $12 to $16 per hour. That supports workforce-tier rents and explains why rents here have plateaued rather than climbed. It does not support a premium.
Supply is the other flag. Serenity Gardens, a 153-unit senior affordable project, is under construction with 125 project-based vouchers, and a separate proposal nearby would add 190 income-restricted units at the pre-application stage. Nothing here signals broad oversupply of market-rate houses. But new apartments and affordable stock can cap rents on 1BR and 2BR units. No sourced vacancy or absorption rate exists at the city level, so that is a supply signal only.
Working DSCR brokers see a recurring pattern in workforce-suburb markets like this one: the file clears on the 3BR and 4BR houses and struggles on smaller units and higher-priced detached stock. Appraisal comps, not rent, are usually what decides how much cash comes out. When sold prices are flat and days on market are stretching, the strongest files come with a clean lease, documented improvements, and reserves sized before the appraisal is ordered.
Multi-unit doesn’t rescue the math. Listing counts on Homes.com, Trulia, and Zillow show only a handful of duplex and multifamily listings, so a 2-to-4 unit refinance will face a thin comp set. No sourced per-unit rent data exists for small multifamily here either.
Turning Proceeds Into the Next Deal
Seasoning runs about six months from title recording, so a recent purchase can’t be pulled early, and the payoff sets the floor under what comes out. Proceeds then depend on rent coverage, reserves of about six months PITIA, and the 75 percent LTV ceiling. Credit tiers start at a 620 floor, and standard programs go up to $3,000,000 on loan size. Nothing here is a guaranteed cash figure.
The redeployment logic is where Miami Gardens gets interesting. Because Bunche Park and Norland carry stronger coverage at lower price points, cash pulled from a Carol City or ZIP 33056 house can fund a lower-priced rental purchase where the ratio clears more comfortably. It’s an equity-rotation trade: take proceeds from higher-valued, lower-coverage property and reinvest into the better rent-to-price math. Against the alternatives, the difference between this and a conventional cash-out is that the property’s rent, not personal income, carries the file. See the guide “Where DSCR and Conventional Diverge” and the cash-out refinance details.
For current guidelines and terms, see Lendmire’s DSCR loan programs page.
Frequently Asked Questions
How do you qualify for a DSCR cash-out refinance in Miami Gardens, Florida?
Rent has to cover the full monthly obligation, with 1.00 as the standard benchmark, though some lenders review lower ratios with stronger compensating factors. The loan is capped at 75 percent of appraised value, and about six months of ownership is typical. Credit, reserves, and the property review all sit on top of the ratio. Final eligibility depends on lender guidelines.
What are the requirements for an investment property loan in Miami Gardens, Florida?
Typical guidance includes a credit floor near 620, reserves of about six months PITIA, and the property’s rental income supporting the payment. Manufactured homes, log homes, and barndominiums fall outside these programs. Exact terms vary by borrower, property, and lender.
DSCR vs. conventional financing
Two common ways to finance an investment property in Miami Gardens, FL. They qualify you differently — here’s how investors weigh them.
Why investors choose it
- Qualifies on the property’s rental income — no personal tax returns, W-2s, or pay stubs needed to document income.
- No personal debt-to-income ceiling to clear, so existing mortgages and obligations don’t cap your borrowing the same way.
- Can be closed in an LLC, keeping the property inside a business entity.
- Built for scaling — not held to the limit on number of financed properties that conventional financing applies.
- Underwriting centers on the deal: generally qualifies when the rent covers the payment, a 1.00x coverage ratio being a common baseline (confirmed in underwriting).
- Designed specifically for investment property, including long-term and, where the program allows, short-term rentals.
Where it’s strong
- Often the lowest ongoing financing cost for a buyer who fully qualifies on personal income — a fit for a first property or a cost-first purchase.
Trade-offs for investors
- Requires full personal income documentation and must fit within a debt-to-income limit — salary, existing debts, and other mortgages all count.
- Typically held in your personal name rather than a business entity.
- Caps how many financed properties you can carry, which can become a ceiling as a portfolio grows.
- Evaluates you as a borrower as much as the property, which usually means more paperwork.
How investors usually choose: a first or single property often optimizes for the lowest financing cost; portfolio builders often optimize for leverage, vesting in an LLC, and scaling past conventional caps. The right answer depends on your goals, the property, and current guidelines — both paths run through select lenders in Lendmire’s wholesale network, with eligibility and terms confirmed in underwriting.
What loan-amount ranges may DSCR lenders review for Miami Gardens rental properties?
Standard programs run up to $3,000,000, and smaller balances route through select lenders in the network. Cash-out files stop at 75 percent LTV. With citywide medians in the mid-$400,000s, most Miami Gardens single-family files sit well inside that range.
Does the flat sale-price trend hurt cash-out proceeds in Miami Gardens?
Yes, if the property was bought recently. Redfin’s sold-price median is up only 1.1 percent while days on market lengthened, and appraisers weight closed sales over index growth. Long-term owners with embedded equity are less exposed.
Can Florida Memorial University enrollment justify a rental near campus?
Only as upside. Record enrollment supports near-campus demand in Norland and Opa-locka North, but it comes off a small base alongside accreditation and financial-risk concerns. Underwrite the file on workforce tenant rents and count students as a bonus.
Where the Asymmetry Sits
The market is pricing Miami Gardens as one blended workforce suburb, but the coverage math says otherwise. Carol City’s detached median is expensive relative to its rent, and Opa-locka North carries flood and softness discounts. The underpriced side is the lower-priced 3BR and 4BR stock in Norland and Bunche Park, where rent-to-price runs clearly ahead of the citywide median and fewer investors are competing for it, given how thin investor lending activity is here. That’s where borrowed equity works hardest.
About Lendmire
Lendmire, NMLS# 2371349, places DSCR investor financing for Miami Gardens, Florida through non-QM wholesale channels that cover 41 markets, including Washington, D.C. The brokerage’s Florida work sits on Lendmire’s Florida DSCR platform, and the firm was named a top-ranked workplace in 2026. Company announcements are collected in the full Lendmire news archive. Investors can reach the team at 828-256-2183. As always, verify current local rental rules, property taxes, and insurance with qualified local professionals before you commit.
Get Started
Ready to find the right loan for you?
In about 30 seconds you can review financing options available for your investment property. No commitment required.
Informational only. Not a Loan Estimate, approval, or commitment to lend. Program availability and eligibility are subject to lender guidelines, credit approval, property review, and underwriting.
References
1. Homes.com
3. Redfin, Miami Gardens Housing Market
5. Zillow Home Values, Miami Gardens
6. City of Miami Gardens, Economic Growth
9. Redfin — Miami Gardens Norland
10. Apartments.com
11. Zillow listings
12. Florida Memorial University
13. Hoodline
15. Redfin
16. WLRN
17. Indeed
18. ZipRecruiter
19. Serenity Gardens
20. Homes.com
21. Trulia
22. Zillow
23. Scotsman Guide — Top Workplaces 2026
This article is part of Lendmire’s investment property cash-out refinance program — full qualification details, guidelines, and scenarios live on the program page.
Related reading: Cash Out Refinance Investment Property in Miami Gardens · DSCR Cash Out Refinance Hialeah: Investor Guide · Cash Out Refinance Investment Property in Tamiami, Florida: The 2026 DSCR Financing Guide to SW 8th Street
Guides: Investment Property Cash-Out Refinance in Miami Gardens, FL · Investment Property Cash-Out Refinance in Florida
Brandon Miller
Founder & CEO, Mortgage Loan Originator, Lendmire LLC
- Mortgage Loan Originator · NMLS# 1129696 · Verify on NMLS Consumer Access
- North Carolina Real Estate Broker · License# 343312 · Verify on NCREC
- North Carolina Insurance Producer · License# 19053198 · Property, Casualty, Life, Health · Verify on NAIC SBS
- Lendmire LLC · Firm NMLS# 2371349 · Verify firm licensure
Legal disclosures. Lendmire (NMLS# 2371349) is a state-licensed mortgage brokerage that arranges financing through wholesale lender relationships. Lendmire is not a direct lender, depository institution, or registered financial advisor. The discussion above is general informational content about real estate financing — it is not financial, legal, or tax advice, and readers should consult licensed professionals for guidance on their individual circumstances. Loan inquiries are subject to lender underwriting; this article does not represent a commitment to lend. Loan terms, rates, and qualification standards vary by borrower, property, and state, and are subject to change at any time. Equal Housing Opportunity. NMLS Consumer Access: nmlsconsumeraccess.org.