
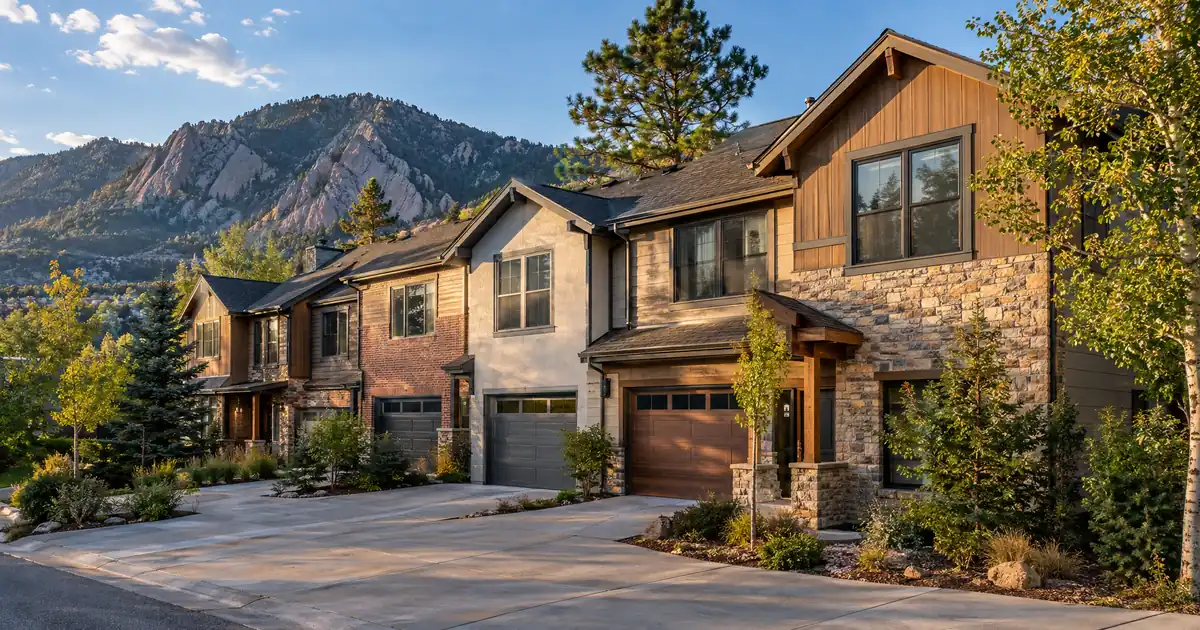
Boulder’s median sale price landed at $885,000 in the latest monthly report, down 9% from a year earlier, according to the Zach Zeldner Team’s broker market update. For an investor planning a DSCR cash out refinance in Boulder, Colorado, that one number matters more than any rent comp. Lenders size the loan on today’s appraised value, not on what the building was worth at purchase or at the last refinance. These specifics are subject to lender guidelines and a full review of property, leverage, and credit.
DSCR Cash-Out Calculator
Run the cash-out numbers in Boulder, CO
Rate source: Freddie Mac 30-yr average via FRED® — Federal Reserve Bank of St. Louis · effective Sep 24, 2026
Prefilled with starting assumptions — enter your property’s value, balance, taxes, and insurance for a more accurate picture.
Program parameters update from Lendmire’s centralized guideline source. Taxes and insurance are editable estimates.
As of Sep 24, 2026 · General Freddie Mac market benchmark, not a Lendmire loan offer. Property value, balance, taxes, and insurance are editable estimates. Maximum loan-to-value varies by lender, program, property type, and seasoning. Not a Loan Estimate, approval, or commitment to lend. Program availability and eligibility are subject to lender guidelines, credit approval, property review, and underwriting.
The Quick Read:
A DSCR cash-out refinance in Boulder, Colorado is underwritten primarily on the property’s rental income measured against its full monthly obligation, so the deal works from a current appraisal, through a seasoning check and a rent schedule, to a lender’s reserve and leverage review, with proceeds sized by whichever constraint binds first: value or coverage.
- Median sale price sits near $885,000, down 9% year over year per broker market data.
- Cash-out typically caps at 75% LTV after roughly six months of title seasoning.
- Attached homes near a $370,000 median are where coverage gets closest to 1.0x.
- Detached homes near $1.0M model well below 1.0x on full PITIA.
- Small multifamily stacks several rents against one loan, the best path to coverage here.
Boulder Market Snapshot
A quick read on the Boulder investor landscape — figures come from the cited sources below. Confirm current property-level numbers before underwriting.
| Metric | Detail |
|---|---|
| Cap rates | Multifamily cap rate 4.50–5.25% (CLS CRE Boulder report) |
| University enrollment | ~68,000 students (University of Colorado System) |
| Employment | 28,063 faculty/staff (University of Colorado System) |
| Vacancy | 4.2% (CLS CRE Boulder report) |
The Equity You Think You Have vs. the Equity the Appraiser Sees
Boulder’s price trend has reversed, and that is the first variable in any cash-out plan. The same broker report shows single-family homes under $2 million at a median of $1,000,999, down 12% year over year. A separate RPR-based report from My Home Team Denver puts the median sold price at $870,000, down 11.22%. Redfin’s earlier snapshot had the median at $1.1M, up 12.2%. Prices have given back a meaningful slice of that run over roughly 18 months. Terms vary by lender guidelines, property type, leverage, credit profile, and full file review.
Methodology matters when reading these figures. Zillow’s home value index shows a typical home value of $957,377, down only 0.1%. That index smooths the mix of homes; the sale-price medians above capture what buyers actually paid in the latest month. For appraisal risk, the sale-price medians are the more useful read.
Three mechanics frame the decision. Seasoning runs about six months from title recording before a cash-out file is typically eligible. The LTV ceiling on cash-out is 75%, lower than purchase leverage. And the equity that comes out is whatever is left after the lender’s reserve, coverage and value tests, so it is not a fixed figure you can plan on from a purchase price. All of this is subject to lender guidelines and varies by borrower, property and loan scenario. The refinance details and DSCR cash-out refi mechanics pages cover the general structure.
A Boulder owner who bought at the peak and is refinancing now may find the usable equity thin. An owner who bought before the run-up has more cushion. Both should order a realistic value opinion before committing to a plan that depends on proceeds.
Where the Coverage Math Breaks (and Where It Holds)
Boulder is a low-yield market, and the coverage number is the binding constraint more often than the LTV cap. DSCR is rent divided by the full monthly obligation: principal, interest, taxes, insurance and any HOA dues. At Boulder prices, that denominator is heavy.
Run the numbers on four property types. These are modeled assumptions, not sourced yields: rents are broker estimates, leverage is 75% LTV, and the coverage bands include taxes and insurance, rounded down. Exact terms depend on the lender’s guidelines, property type, leverage, and a full review of the borrower’s file.
| Property | Price anchor | Assumed rent | Modeled coverage |
|---|---|---|---|
| Detached single-family | About $1.0M | About $3,900 | Around 0.7x |
| 2-bed townhome | About $575,000 | $2,400-$2,500 | Mid-0.7x range |
| 3-bed townhome | About $839,000 | $3,200-$3,800 | Low-to-mid 0.8x |
| Attached median | About $370,000 | About $2,400 | About 1.1x before HOA |
The detached rent comes from an Attitude Homes estimate. The townhome prices and rent bands come from The Good Neighbors duplex and townhome guide, which puts even the affordable attached band near 5% gross at best. The $370,000 attached median, down 11% year over year on 7.2 months of supply, is from the Zeldner report. That median mixes very small condos with townhomes, and condo HOA dues pull the ratio down. Treat it as a ceiling, not a base case. Every figure here varies by lender and program — guidelines, property type, leverage, and credit profile all apply.
Sub-1.00 is the normal starting point for most Boulder detached homes. A 1.00x benchmark is common because rent covers the payment at that level. Some lenders review lower ratios, but usually with lower leverage, stronger credit, larger reserves or different pricing. The structures worth discussing are a sub-1.00 program, an interest-only period, a lower LTV, or a different property in the portfolio carrying the proceeds. All of these are options a lender would review, and eligibility review depends on credit approval, reserves and property review.
The broader question is whether to use a sub-1.00 structure at all. If the building has a scarcity-and-appreciation story and the owner can carry a thin ratio, it’s a defensible choice. If the borrower is reaching for it because nothing in the portfolio clears 1.00x, the problem is the asset mix, not the loan.
A flip point on product choice: for a W-2 borrower with a high income and one or two financed rentals, conventional cash-out may carry a lower cost, since Boulder’s thin yields make DSCR coverage the hurdle. DSCR becomes the practical path for LLC-held portfolios, self-employed operators and investors past four financed properties, where personal income documentation stops scaling. DSCR versus conventional is the place to weigh that. LLC-titled properties are subject to lender program eligibility.
Small Multifamily
Two-to-four unit buildings are the most credible route to coverage in Boulder. NeighborhoodScout reports that 43% of housing is large apartment complexes, 38.72% is single-family detached and only 8.54% is duplexes, converted homes or small apartment buildings. That small slice is scarce, which helps both coverage and exit liquidity.
The logic is simple. A $1.0M detached home collects one rent. A duplex, triplex or fourplex stacks several rents against one loan, so coverage can move from the 0.7x band toward 1.0x depending on price and rent roll. Homes.com lists 109 multi-family properties in Boulder, priced from $170,000 to $5.85 million. The low end isn’t a realistic comp; ignore it. Listings also show triplexes in East Boulder and Mapleton, a four-unit property in Keewaydin and investment properties near Goss-Grove.
No verified per-building rent roll was available, so any coverage figure for a specific fourplex has to come from actual leases and recent sales. Pull three to five recent duplex, triplex and fourplex sales with their rent rolls before building a refinance plan around a number.
One more tradeoff. A commercial broker report at CLS CRE cites multifamily cap rates of 4.50% to 5.25%. That is directional, since it reflects larger commercial stock more than 2-4 unit residential. But it confirms the point: Boulder pays you in scarcity and appreciation, not cash flow. A refinance in this market depends on holding value. A cash-out taken against a building whose value is still sliding pulls equity out of the part of the return that’s already shrinking.
Neighborhoods That Pencil Best
The south and southeast sides offer the lowest rents and the lowest entry prices, and the ranking matters more than any single figure. Rent.com shows one-bedroom averages of $1,525 in Flatirons, $1,550 in Martin Acres and $1,562 in Baseline, against a citywide one-bedroom average of $2,380. The citywide number conflicts with other sources, so use this data for relative ranking only. Lower rent doesn’t automatically mean lower coverage, because purchase prices there are lower too. Compare price per unit against rent area by area.
Martin Acres and the Table Mesa area are the city’s entry point: 1950s ranches and tri-levels near campus and employers. Campus-adjacent University Hill comes in at $1,650 for a one-bedroom, while Goss-Grove is about $3,183 for a comparable apartment; verify unit type before quoting either. East Boulder near Foothills Hospital shows a one-bedroom at $2,164, with Arapahoe Ridge at $2,429. Redfin’s neighborhood rental data lists median rents of $3,500 downtown, $3,495 in North Boulder and $3,175 in South Boulder, though it mixes property types.
Gunbarrel is mostly unincorporated county, tied historically to IBM, with office-park tenants. South Table Mesa sits around $1.25 million, which is a poor fit for DSCR. Mapleton Hill, Newlands and Chautauqua are appreciation plays; their prices make 1.0x coverage unrealistic.
The stronger play for coverage might be east or southeast Boulder small multifamily over anything west of Broadway, though investors prioritizing long-term appreciation could argue the opposite.
Demand Anchors That Hold the Rent Roll Together
Tenant demand comes from employment, and Boulder’s base is unusually deep for its size. University of Colorado Boulder enrolls 34,101 undergraduates on a 600-acre campus. The CU system counts nearly 68,000 students and 28,063 faculty and staff across its campuses. Boulder Community Health is the city’s second-largest employer, anchored by Foothills Hospital with 149 licensed beds. The City of Boulder’s economic report lists the ten largest employers: Ball Aerospace, Boulder Community Health, Boulder County, Boulder Valley School District, the City, Google, IBM, Medtronic, UCAR/NCAR and CU Boulder. It counts about 2,400 employers with five or more staff.
That mix of federal labs, aerospace, health care and higher education supports steady long-term renter demand. It does not produce population growth. The Census Bureau’s QuickFacts shows an estimate of 105,898, below the 108,254 census base, and Colorado Demographics shows 0.0% change over five years. Demand is stable, not expanding.
What’s the Catch on Vacancy?
Boulder is tighter than the metro, though it isn’t immune to the oversupply hitting Denver. The Colorado Sun reported apartment vacancy of 6.5% for Boulder and Broomfield counties against 7.6% for the metro overall, the highest in 16 years. Concessions averaged 9.5% of gross rent. The Denver Gazette later noted increased vacancies in Adams, Boulder and Broomfield counties, with average rent of $1,889 across Boulder and Broomfield. A commercial broker separately cites 4.2% Boulder multifamily vacancy, which conflicts with the 6.5% figure. The 6.5% covers the county, not just the city.
Underwriting 5% to 7% vacancy is a reasonable planning band. Newer large complexes offering concessions compete directly with small-building landlords, and a rent schedule that assumes full occupancy invites an appraisal conversation.
Working DSCR brokers see a recurring pattern in high-price, low-yield markets like this one: the appraisal and the market-rent schedule decide proceeds more often than credit or reserves do. Files that arrive with a documented rent roll, current leases and a realistic vacancy assumption tend to hold their numbers through review. Files built on a listing-page rent estimate tend to shrink.
Where the Proceeds Go
The cash-out thesis depends on what the investor does with the money. Redeploying into a small multifamily building in east or southeast Boulder, where coverage has a chance of clearing 1.0x, makes the case straightforward. Moving equity into a lower-priced adjacent market is a different calculation. Broker listings put Federal Heights near $346,000 and Westminster near $485,000, where the same rent buys far more yield. The tradeoff is losing Boulder’s scarcity premium and its research-and-campus demand base.
On parameters, expect typical guidance of a 620 credit floor, with tiers at 660, 680 and 700 improving terms. Reserves run about six months of PITIA, and about nine months above $1,500,000. Standard programs go up to $3,000,000. Every figure is subject to lender guidelines, credit approval and property review. Verify current local rental rules, taxes and insurance with qualified local professionals before committing proceeds.
For a sizing conversation, investors can talk to Lendmire or call 828-256-2183. A broker can also walk through DSCR loan options for Colorado investors and what the full breakdown of coverage means for a specific building.
DSCR vs. conventional financing
There are two common ways to finance an investment property in Boulder, CO, and they qualify you differently — here’s how investors weigh them.
Why investors choose it
- Qualifies on the property’s rental income — no personal tax returns, W-2s, or pay stubs needed to document income.
- No personal debt-to-income ceiling to clear, so existing mortgages and obligations don’t cap your borrowing the same way.
- Can be closed in an LLC, keeping the property inside a business entity.
- Built for scaling — not held to the limit on number of financed properties that conventional financing applies.
- Underwriting centers on the deal: generally qualifies when the rent covers the payment, a 1.00x coverage ratio being a common baseline (confirmed in underwriting).
- Designed specifically for investment property, including long-term and, where the program allows, short-term rentals.
Where it’s strong
- Often the lowest ongoing financing cost for a buyer who fully qualifies on personal income — a fit for a first property or a cost-first purchase.
Trade-offs for investors
- Requires full personal income documentation and must fit within a debt-to-income limit — salary, existing debts, and other mortgages all count.
- Typically held in your personal name rather than a business entity.
- Caps how many financed properties you can carry, which can become a ceiling as a portfolio grows.
- Evaluates you as a borrower as much as the property, which usually means more paperwork.
How investors usually choose: a first or single property often optimizes for the lowest financing cost; portfolio builders often optimize for leverage, vesting in an LLC, and scaling past conventional caps. The right answer depends on your goals, the property, and current guidelines — both paths run through select lenders in Lendmire’s wholesale network, with eligibility and terms confirmed in underwriting.
What a Boulder Appraiser Would Tell You
Price the refinance off the most recent attached and detached sales on your block, not off what a neighbor got before the market turned. In Boulder, rent roll decides whether the coverage works, and scarcity decides whether the value holds, so the small multifamily on the south side with real leases in place will always be easier to refinance than the $1 million house with a hopeful rent estimate.
Frequently Asked Questions
How do you qualify for a DSCR cash-out refinance in Boulder, Colorado?
The file is reviewed on the property’s rent against its full monthly obligation, with a typical 1.00x benchmark, plus credit, reserves and seasoning of about six months from title recording. Cash-out LTV tops out at 75%. Boulder’s price levels mean coverage is usually the hurdle, so lower leverage or an interest-only structure often enters the conversation. Eligibility varies by lender, borrower and property.
What are the requirements for a cash-out refinance on a Boulder investment property?
Typical guidance includes a credit floor of 620, about six months of PITIA in reserves (about nine above $1,500,000), a current appraisal and a market-rent schedule. Loan amounts reach $3,000,000 on standard programs. Manufactured homes, log homes and barndominiums fall outside these programs. All terms are subject to lender guidelines.
Does a price decline affect whether an older Boulder rental can be refinanced?
Yes, because the loan is sized on current appraised value. A median sale price down 9% year over year means equity built at a higher valuation can be smaller today. Owners who bought before the run-up typically retain more cushion than recent buyers.
Are duplexes and fourplexes easier to refinance in Boulder than single-family homes?
They often show better coverage, since several rents stack against one loan. They are also scarce, at roughly 8.54% of the housing stock. A documented rent roll and current leases matter more than the property type alone.
For current guidelines and terms, see Lendmire’s DSCR loan programs page.
About Lendmire
As a DSCR and non-QM mortgage broker, Lendmire (NMLS# 2371349) connects investors with wholesale lending channels across 41 markets, including Washington, D.C. Lender review centers on the property’s rental income rather than the borrower’s traditional personal-income documentation, which suits self-employed operators and portfolios beyond four financed properties. The brokerage is recognized as a 2026 Scotsman Guide Top Mortgage Workplace and a 2025 Scotsman Guide Top Mortgage Workplace.
Get Started
Ready to find the right loan for you?
In about 30 seconds you can review financing options available for your investment property. No commitment required.
Informational only. Not a Loan Estimate, approval, or commitment to lend. Program availability and eligibility are subject to lender guidelines, credit approval, property review, and underwriting.
References
1. Zach Zeldner Team, Boulder market update
2. CLS CRE
3. University of Colorado System
5. Redfin — Boulder Housing Market
6. Zillow Home Value Index, Boulder
7. The Good Neighbors duplex and townhome guide
9. Homes.com
10. Rent.com
11. Redfin’s neighborhood rental data
12. Boulder Community Health, Fast Facts
13. City of Boulder economic report
14. U.S. Census Bureau QuickFacts, Boulder
16. Colorado Sun, Apartment Association of Metro Denver data
17. Denver Gazette
18. a 2026 Scotsman Guide Top Mortgage Workplace
19. a 2025 Scotsman Guide Top Mortgage Workplace
This article is part of Lendmire’s investment property cash-out refinance program — full qualification details, guidelines, and scenarios live on the program page.
Related reading: Luxury Rental DSCR Loans In New Jersey · Jersey Shore Vacation Rental Loans: DSCR Financing In Ocean City, Cape May And Long Beach Island · DSCR Cash-out Refinance In New Jersey: Pulling Equity From A Rental
Guides: Investment Property Cash-Out Refinance in Boulder, CO · Investment Property Cash-Out Refinance in Colorado
Brandon Miller
Founder & CEO, Mortgage Loan Originator, Lendmire LLC
- Mortgage Loan Originator · NMLS# 1129696 · Verify on NMLS Consumer Access
- North Carolina Real Estate Broker · License# 343312 · Verify on NCREC
- North Carolina Insurance Producer · License# 19053198 · Property, Casualty, Life, Health · Verify on NAIC SBS
- Lendmire LLC · Firm NMLS# 2371349 · Verify firm licensure
Required disclosures. Lendmire (NMLS# 2371349) operates as a licensed mortgage broker, not a direct lender or depository. The discussion in this article is general in nature and should not be relied upon as financial, legal, or tax advice — every investment scenario is unique and should be reviewed by a qualified professional. Any loan inquiry is subject to lender underwriting, and this article is not a commitment to lend or a guarantee of approval. Mortgage rates, loan terms, and program guidelines vary by borrower, property, and state, and may change without notice. Equal Housing Opportunity. Verify licensure at NMLS Consumer Access.