
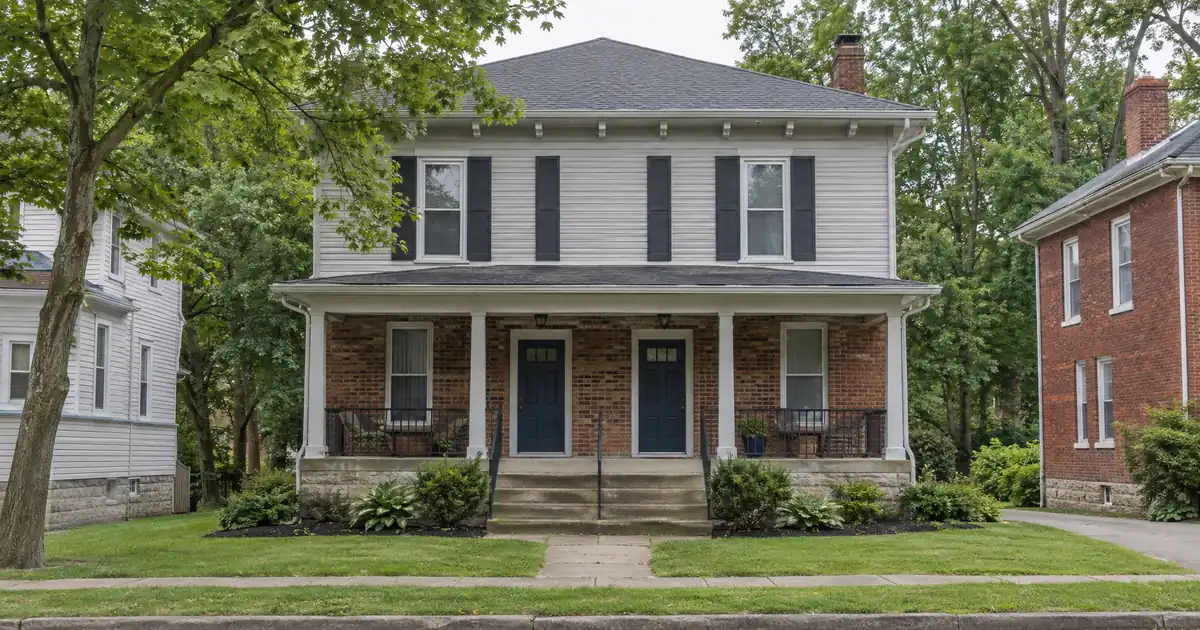
A single-family rental at Shelbyville’s median rent does not clear a 1.00 coverage ratio on a cash-out refinance once taxes and insurance are in the debt service. Zumper puts the median rent at $1,020 across property types, while Zillow puts the typical home value at $202,418. Those two numbers sit close to 0.5% rent-to-value, and that ratio decides everything about equity extraction here. Small multifamily doesn’t change the picture either.
DSCR Cash-Out Calculator
Run the cash-out numbers in Shelbyville, IN
Rate source: Freddie Mac 30-yr average via FRED® — Federal Reserve Bank of St. Louis · effective Sep 24, 2026
Prefilled with starting assumptions — enter your property’s value, balance, taxes, and insurance for a more accurate picture.
Program parameters update from Lendmire’s centralized guideline source. Taxes and insurance are editable estimates.
As of Sep 24, 2026 · General Freddie Mac market benchmark, not a Lendmire loan offer. Property value, balance, taxes, and insurance are editable estimates. Maximum loan-to-value varies by lender, program, property type, and seasoning. Not a Loan Estimate, approval, or commitment to lend. Program availability and eligibility are subject to lender guidelines, credit approval, property review, and underwriting.
The Quick Read:
A DSCR cash-out refinance in Shelbyville, Indiana is underwritten primarily on the property’s rental income measured against its full monthly obligation. The deal works from ownership seasoning, to a rent schedule and appraisal, to a lender’s coverage and reserve review. Proceeds depend on all of it, and none of it is guaranteed.
- Zumper’s median rent is $1,020, so single-family coverage runs thin at the 75% LTV ceiling.
- Small multifamily stacks several rents against one payment and is the better coverage product here.
- Redfin’s November sample was only 19 sales, so appraisal comps are scarce.
- New apartment supply on Progress Parkway competes with older small multifamily.
- Plan on cash-flow-led holds. Local list prices are flat to slightly down.
- Every figure here varies by lender and program — guidelines, property type, leverage, and credit profile all apply.
Lendmire (NMLS# 2371349) is a DSCR-focused mortgage broker. Through Lendmire’s DSCR program footprint — 41 markets, including Washington, D.C. — lenders may review qualifying rental income subject to program guidelines for Shelbyville, Indiana investors. This article assumes the property is already owned. The purchase side is a different file. Here the question is how much equity comes out, and what the property has to look like to support it.
Shelbyville Market Snapshot
A quick read on the Shelbyville investor landscape — figures come from the cited sources below. Confirm current property-level numbers before underwriting.
| Metric | Detail |
|---|---|
| Home prices | 19 sales (Redfin) |
| Employment | Ryobi 977 employees (Shelby County Development) |
Start With the Older In-Town Stock
The older in-town housing near downtown and the Public Square is the most natural cash-out candidate in Shelbyville. It is where small multifamily and older single-family rentals sit closest to employers, parks, and the downtown events calendar. No source in the research gives neighborhood-level rent or price data for Shelbyville, so this section stays qualitative. Anyone who quotes a downtown rent figure is guessing.
What can be said is structural. RentCafe reports that 45% of Shelbyville households rent, which is 3,909 households. Point2Homes counts 1,569 rentals and finds two-bedroom units are the largest share at 43%. A two-bedroom-heavy rental base points to 2BR duplexes and triplexes as the product the market already understands. The rental stock skews to buildings from the 1970s through the 1990s, which also means condition adjustments will show up in the appraisal.
Inventory is thin. Redfin’s investment-property view shows 11 multi-family units for sale, including a brick duplex with two bedrooms and two baths on each side. On the commercial side, LoopNet shows a 3-unit building asking $435,000 and another 3-unit asking $695,000 with a seller-stated 6.50% cap rate. Seller-stated caps are marketing, not underwriting. The lender will underwrite from the actual rent roll, not the listing.
Here’s the catch for a cash-out: few comparable sales means few anchors for the appraiser. That shapes everything in the next two sections.
The Coverage Math: House Versus Triplex
On modeled assumptions, a triplex at the 75% LTV ceiling can come closer to carrying its full obligation than a single-family house at median rent, because three rent streams are set against one mortgage. The coverage ratio is monthly rent divided by the full monthly obligation: principal, interest, taxes, insurance, and any dues. Every figure below is a modeled input, not a sourced market fact. Final terms depend on lender guidelines, property type, leverage, and the borrower’s complete credit picture.
Single-family, modeled. Take a home at the typical value of $202,418 and a 75% LTV cash-out. Use the $1,020 median rent as the modeled rent and a 30-year amortization including taxes and insurance. Coverage lands somewhere in the 0.8 to 0.9 range. Even at the $1,133 RentCafe two-bedroom average, it stays under 1.00. Note that RentCafe’s figure covers only buildings with 50 or more units, so it overstates what a small rental house will rent for. These specifics are subject to lender guidelines and a full review of property, leverage, and credit.
A sub-1.00 file isn’t dead, but it isn’t a clean 1.00 file either. A lender may review it under a sub-1.00 program, an interest-only structure, or with lower leverage or stronger compensating factors such as higher reserves. Each of those carries different pricing and eligibility, and none is assured. Qualification stays subject to lender guidelines, credit approval, and property review.
Triplex, modeled. Run the numbers on a triplex valued near $435,000 at 75% LTV. Assume each unit rents at a modeled $1,020. At that level, full coverage including principal, interest, taxes, insurance, and any association dues comes out well below 1.00, and it stays below 1.00 even if the rents sit nearer the $1,133 two-bedroom average. Three rents against one payment helps, but it does not close the gap on its own at this leverage. The ratio improves with unit count because taxes and insurance don’t triple when the rents do, though in this scenario that effect is not enough to reach a clean 1.00. A file like this would likely need review under a sub-1.00 program, lower leverage, or stronger compensating factors. Terms vary by lender guidelines, property type, leverage, credit profile, and full file review.
One caution on the triplex math: the $1,020 median blends all property types and bedroom counts. A true three-bedroom unit might rent above it and a one-bedroom below. Underwrite from the signed leases on the specific building. If the rent roll comes in under the modeled figure, the coverage ratio is the number to stress-test, since even the modeled case already sits below 1.00 and a thinner rent roll would only widen that gap.
For the underlying mechanics, Lendmire’s DSCR walkthrough covers how the ratio is built, and a comparison of “Where DSCR and Conventional Diverge” explains why a conventional file would read this property differently.
Appraisal Risk Is the Real Constraint on Proceeds
The appraisal, not the coverage ratio, is usually what limits cash-out proceeds in a small market like Shelbyville. The LTV ceiling is a percentage of an appraised value, and in a market with scarce sales, that value is the least certain input.
Look at what the data says. Redfin’s November reading shows a median sale price of $255K, up 47.5% year over year, off only 19 sales. The same data shows price per square foot at $118, down 7.8%. That is a mix effect, not appreciation. Zillow’s typical home value, a smoothed series, shows 3.8% year-over-year growth. Redfin’s $255K is a median of what sold, while Zillow’s $202,418 is a modeled typical value. They measure different things, so don’t average them.
Listing data points the same cautious way. Movoto shows a median list price near $270K, down 3% year over year. Time on market has lengthened compared with the prior year. List prices are not sale prices, but flat-to-down asking prices don’t support an equity-from-appreciation plan. Exact terms depend on the lender’s guidelines, property type, leverage, and a full review of the borrower’s file.
That leaves a practical rule. Don’t underwrite a cash-out on an assumed 47% gain, and don’t plan around a rising market during the seasoning period. Proceeds come from the original buy price, value-add work, and the rent roll. Ask for an in-city comp set. County-level and rural sales can sit at steep discounts and pull an appraisal down, and those outliers belong in a different market from a Shelbyville duplex.
When the value comes in light, an appraisal reconsideration request is a routine step, not an emergency. A packet of recent in-city sales, condition adjustments, and the rent schedule gives the reviewer something to work with. With only a handful of monthly sales, the packet matters more here than in a deeper market.
Seasoning and the 75% Ceiling
The mechanics for equity extraction are simple on paper. Typical program guidance on most files calls for about 6 months of ownership, measured from title recording, before a cash-out is available. Cash-out leverage tops out at 75% LTV, a lower cap than a purchase carries. Minimum coverage is typically 1.00, credit tiers start at a 620 floor, and reserves run about 6 months of the full obligation. Reserves rise to about 9 months on balances above $1,500,000. Loan sizes go up to $3,000,000 on standard programs, and smaller balances route through select lenders in the network. All of this is subject to lender program eligibility and varies by borrower, property type, and coverage ratio.
Where files get kicked back is seasoning documentation. Investors who bought recently should have the settlement statement showing recording on hand. Investors who bought through an LLC should have the entity documents ready, since LLC closings are subject to program terms. The reserves line is the other trap. Cash-out proceeds don’t count toward reserves on the same file, so the 6 months has to already be sitting in an account.
Equity available depends on rent used for lender review, the full obligation, reserves, and the 75% ceiling. It is not a guaranteed cash figure. For the general structure, see the guide on pulling equity out.
The Progress Parkway Problem: New Supply
New market-rate apartments on the Progress Parkway and Highpointe Boulevard corridor are the main market-rate threat to older small multifamily rent rolls. The City of Shelbyville describes Summit of Shelbyville as a $35M, 288-unit market-rate development. Phase 1 is 72 two-bedroom, 1.5-bath units, and ground has been broken. The same city communication names two other projects: The Mill, affordable apartments, and Eight37 Lofts, workforce housing.
Two-bedroom units are the dominant rental size, and the new phase is built as two-bedroom product. That puts the new complex in direct competition with an older duplex’s two-bedroom side. The old unit competes on price, and the new one on finish and amenities.
The housing pipeline is real beyond apartments. The city’s housing growth release says single-family permits averaged just under 40 a year in the first half of the last decade and nearly 90 a year since. Residential investment averaged $38.6M a year over the most recent five-year span. More new homes also means more owner-occupied options for renters who might otherwise stay in a duplex.
None of this breaks the thesis, but it caps it. An older small multifamily property with unit rents at or modestly below the new product’s holds its position. A property pushing rents toward the new-build tier invites vacancy. Be careful with the rent schedule, since it is the number that sets the coverage ratio and the number most likely to get pushed back on. Strong rent growth in the aggregator data is a double-edged signal. RentCafe shows average rent up 10.37% year over year and Zumper shows 16%, but those figures come from different property mixes and measure different things. Use them as direction, not as an underwriting rent.
Who Rents Here: Plants, a Casino, and a Hospital
Manufacturing, casino work, and health care are the tenant base, and they give the rent roll a steady footing that a pure appreciation market wouldn’t. Data USA shows manufacturing employs 2,501 Shelbyville residents, health care and social assistance 1,218, and retail 879. Shelbyville’s 2025 population estimate is 21,204, and it is the county seat of Shelby County.
The county’s ranked employer list puts Horseshoe Indianapolis first, followed by Knauf Insulation, Penske Logistics, Ryobi Die Casting, and Pilkington North America. That list gives rank only, not headcounts. The Shelby County Development Corporation lists Ryobi Die Casting USA at 977 employees. Major Health Partners, which runs the community hospital, describes Shelbyville as off I-74 and 25 minutes southeast of I-465. No hospital headcount surfaced in the research, so that stays qualitative.
Location carries weight too. Per zip-codes.com, Shelbyville sits in the Indianapolis-Carmel-Greenwood metro of about 2.1 million people. That helps hold demand from workers who want an Interstate 74 commute without Indianapolis rents. There is no college in town, so student housing is not a driver. This is a workforce-rental market, and the appraisal and rent schedule should be written that way.
Two growth stories are worth tracking, but neither belongs in an underwriting assumption. Prime Beverage Group plans a 915,720-square-foot facility in the Velocity 74 Trade Center in Fairland, with 181 jobs expected over the first three years. Fairland sits outside Shelbyville city limits, so only part of that demand lands in the city. Then there is the proposed Prologis data-center campus at I-74 and SR-44. According to The Republic, it would be up to 11 buildings on 429 acres, with about 450 permanent jobs and 6,750 construction jobs projected. It still needs further approvals and has drawn community opposition. Treat it as an upside option for rental demand, not a foundation for it.
What Derails Shelbyville Cash-Out Files
Four things derail cash-out files in markets like this one, and none of them is the coverage ratio. The common friction point in small, thinly traded markets is documentation that doesn’t line up with the appraisal. Rent schedules built from asking rents rather than signed leases get questioned. Entity documents that don’t match the title vesting get kicked back. Reserve accounts that were quietly drained for the renovation that justified the cash-out leave the file short. And in a market where few sales come through, a single weak comp can reset the value, and the file with a ready reconsideration packet recovers while the one without it restarts.
The cleaner files tend to be the ones where the investor assembled the lease copies, the settlement statement, the entity paperwork, and the reserve statements before the file went in, not after the lender asked.
DSCR vs. conventional financing
There are two common ways to finance an investment property in Shelbyville, IN, and they qualify you differently — here’s how investors weigh them.
Why investors choose it
- Qualifies on the property’s rental income — no personal tax returns, W-2s, or pay stubs needed to document income.
- No personal debt-to-income ceiling to clear, so existing mortgages and obligations don’t cap your borrowing the same way.
- Can be closed in an LLC, keeping the property inside a business entity.
- Built for scaling — not held to the limit on number of financed properties that conventional financing applies.
- Underwriting centers on the deal: generally qualifies when the rent covers the payment, a 1.00x coverage ratio being a common baseline (confirmed in underwriting).
- Designed specifically for investment property, including long-term and, where the program allows, short-term rentals.
Where it’s strong
- Often the lowest ongoing financing cost for a buyer who fully qualifies on personal income — a fit for a first property or a cost-first purchase.
Trade-offs for investors
- Requires full personal income documentation and must fit within a debt-to-income limit — salary, existing debts, and other mortgages all count.
- Typically held in your personal name rather than a business entity.
- Caps how many financed properties you can carry, which can become a ceiling as a portfolio grows.
- Evaluates you as a borrower as much as the property, which usually means more paperwork.
How investors usually choose: a first or single property often optimizes for the lowest financing cost; portfolio builders often optimize for leverage, vesting in an LLC, and scaling past conventional caps. The right answer depends on your goals, the property, and current guidelines — both paths run through select lenders in Lendmire’s wholesale network, with eligibility and terms confirmed in underwriting.
Where do the proceeds go? That’s the other half of the plan. A seasoned cash-out turns a stabilized property into capital for the next acquisition. In Shelbyville, with its thin small-multifamily supply and a limited number of triplexes for sale, the better move is often to keep the acquisition pipeline moving rather than wait for a perfect listing. Investors weighing a second property should model coverage on the next building before pulling the equity, not after.
Taxes, insurance, and local rental rules vary by property, and investors should verify current local rules, taxes, and insurance with qualified local professionals. Beyond that, budget for them in the coverage math as above and move on.
Frequently Asked Questions
How do you qualify for a DSCR loan in Shelbyville, Indiana?
Qualification rests mainly on whether the property’s rent covers its full monthly obligation, measured as a coverage ratio. A 1.00 baseline is common, a credit score floor of 620 applies on most programs, and reserves of about 6 months are typical. Some lenders review lower ratios with compensating factors such as lower leverage. Exact eligibility depends on lender guidelines, credit profile, reserves, and property review.
What are the requirements for an investment property cash-out loan in Shelbyville, Indiana?
On most files, the property has been owned about 6 months from title recording, leverage tops out at 75% LTV, and the rent schedule has to support the coverage ratio. Reserves of about 6 months of the full obligation are typical, and the appraisal sets the value. Manufactured homes, log homes, and barndominiums fall outside the network’s DSCR programs.
Will the Summit of Shelbyville apartments hurt my duplex’s rent roll?
It can pressure two-bedroom rents if the older unit prices near the new building. The first phase is 72 two-bedroom units, which compete directly with the dominant rental size. Older units tend to hold up when they price modestly below new product, and a conservative rent schedule also gives the coverage ratio more cushion.
Why do Shelbyville appraisals come in light so often?
Few sales feed the comp set. Redfin’s November sample held only 19 sales, and rural or outlying sales can pull values down if they sneak into the comp set. Asking for in-city comps and submitting a reconsideration packet with condition adjustments and the rent schedule recovers much of the gap.
What DSCR terms may lenders review for investors in Indiana?
A key feature is that lenders evaluate property cash flow rather than personal income, and for a cash-out that typically comes with a 75% LTV ceiling. Terms are subject to lender guidelines. Investors can get a DSCR quote or call 828-256-2183. The statewide overview lives at Lendmire’s Indiana DSCR loan programs.
For current guidelines and terms, see Lendmire’s DSCR loan programs page.
About Lendmire
Lendmire (NMLS# 2371349) is a mortgage brokerage focused on DSCR investor financing, helping arrange programs through wholesale and investor-lending channels in 41 markets, including Washington, D.C. Lenders evaluate DSCR loans on property cash flow rather than personal income, subject to lender guidelines. The programs support LLC closings and accommodate investors with four or more financed properties. Lendmire is a Scotsman Guide Top Mortgage Workplace in both 2025 and 2026.
Against Greenwood, the other named city in the Indianapolis metro, the math favors Shelbyville for small multifamily coverage right now, because the entry price is lower and three rents carry one payment. Greenwood has the deeper sales history that makes appraisals easier, and Shelbyville’s edge only holds if the rent roll is documented and the comp set is built from in-city sales.
Get Started
Ready to find the right loan for you?
In about 30 seconds you can review financing options available for your investment property. No commitment required.
Informational only. Not a Loan Estimate, approval, or commitment to lend. Program availability and eligibility are subject to lender guidelines, credit approval, property review, and underwriting.
References
1. Zumper
2. Zillow
3. Redfin — Shelbyville Housing Market
4. Shelby County Development Corporation
5. RentCafe
6. Point2Homes
7. Redfin’s investment-property view
8. LoopNet
9. Movoto
11. shelbyville.in.gov — Housing growth release
12. Data USA
13. 21,204
14. hoosierdata.in.gov — Major Employers
17. The Republic
18. 2025
19. 2026
This article is part of Lendmire’s investment property cash-out refinance program — full qualification details, guidelines, and scenarios live on the program page.
Related reading: Luxury Rental DSCR Loans In New Jersey · Jersey Shore Vacation Rental Loans: DSCR Financing In Ocean City, Cape May And Long Beach Island · DSCR Cash-out Refinance In New Jersey: Pulling Equity From A Rental
Guides: Investment Property Cash-Out Refinance in Indiana
Brandon Miller
Founder & CEO, Mortgage Loan Originator, Lendmire LLC
- Mortgage Loan Originator · NMLS# 1129696 · Verify on NMLS Consumer Access
- North Carolina Real Estate Broker · License# 343312 · Verify on NCREC
- North Carolina Insurance Producer · License# 19053198 · Property, Casualty, Life, Health · Verify on NAIC SBS
- Lendmire LLC · Firm NMLS# 2371349 · Verify firm licensure
Disclosures. The information presented in this article is general market commentary, not financial, legal, or tax advice. Lendmire is a mortgage brokerage (NMLS# 2371349) — not a direct lender or depository institution — and loan placement is subject to lender underwriting. Nothing in this content represents a commitment to lend. Loan terms, pricing, and program availability vary based on borrower qualifications, property characteristics, and state of subject property, and are subject to change at any time. Lendmire complies with Equal Housing Opportunity requirements. Consumer access: nmlsconsumeraccess.org.