
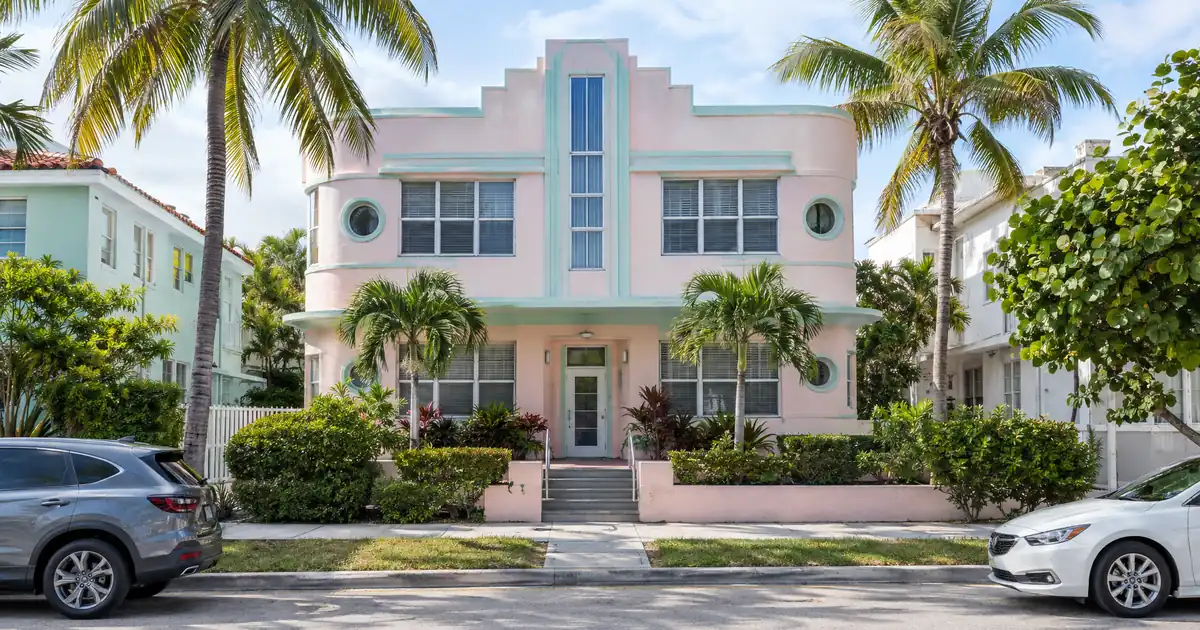
North Beach’s median sale price sits near $470K, down 27.4 percent year over year, while Mid-Beach’s median is $765K, up 36.0 percent. Same island, same zip-code prestige, opposite trajectories. For a DSCR investor, the math favors the falling-basis side. Mid-Beach is an appreciation bet, and you can’t underwrite appreciation with a coverage ratio.
DSCR financing for Miami Beach, Florida investors runs through wholesale lenders that Lendmire works with across 41 markets, including D.C. Lendmire (NMLS# 2371349) is a DSCR-focused mortgage broker. It arranges these files, and the lenders review eligibility and approve. Investors who want the state-level view can start with Lendmire’s Florida DSCR platform.
DSCR Calculator
Run the numbers in Miami Beach, FL
Rate source: Freddie Mac 30-yr average via FRED® — Federal Reserve Bank of St. Louis · effective Sep 24, 2026
Prefilled with starting assumptions — enter your own rent or nightly figures, taxes, insurance, and HOA for a more accurate picture.
Program parameters update from Lendmire’s centralized guideline source. Taxes and insurance are editable estimates.
As of Sep 24, 2026 · General Freddie Mac market benchmark, not a Lendmire loan offer. Rent, nightly rate, occupancy, taxes, and insurance are editable estimates. Short-term rental figures are estimates only and vary significantly by season, property type, management approach, and local short-term-rental rules — confirm local regulations before relying on them. Qualifying income for short-term rentals varies by program — some use appraisal market rent, others use documented STR history or projections — and is confirmed in underwriting. Not a Loan Estimate, approval, or commitment to lend. Program availability and eligibility are subject to lender guidelines, credit approval, property review, and underwriting.
Key Takeaways:
Investment property financing in Miami Beach, Florida fits investors who can buy small multifamily or a low-basis North Beach unit, because DSCR is underwritten primarily on the property’s rental income measured against its full monthly obligation. Trophy-tier condos rarely produce that coverage, so the island sorts buyers by basis.
- North Beach median sits near $470K, with 1BR asking rents around $1,950.
- Single condos at median prices model well below 1.00 including taxes and insurance.
- A four-unit South Beach listing models just under 1.00 at 75 percent LTV.
- South of Fifth averages roughly $3.0 million for condos. Skip it for cash flow.
- Mount Sinai anchors long-term tenant demand with more than 4,000 employees.
Miami Beach Market Snapshot
A quick read on the Miami Beach investor landscape — figures come from the cited sources below. Confirm current property-level numbers before underwriting.
| Metric | Detail |
|---|---|
| Home prices | $635K median sale price (Redfin Miami Beach Housing) |
| Typical rents | $2,148 median gross rent (2024) (City-Data.com Miami Beach) |
| Cap rates | 5.31% cap rate (Homes.com Miami Beach) |
| Population | 83,264 population |
| Employment | 4,000+ employees (Mount Sinai Medical Center) |
One Island, Three Different Markets
Miami Beach is not one market. South of Fifth, Mid-Beach, and North Beach each have their own price point, building stock, and buyer pool, and a single “Miami Beach” number hides all of it.
The city-level data bears that out. Redfin reports a citywide median sale price that has risen over the past year, while Zillow’s home value index shows an average home value that has edged slightly lower. The two don’t contradict each other. They measure different things, and the gap shows how much the mix of units moves the headline.
Per Census Bureau QuickFacts, the city holds 83,264 residents packed into 7.7 square miles, about 10,824 per square mile. It’s a barrier island with no room to add land, and new construction is minimal. Supply stays tight, which supports rent stability. It doesn’t make the entry price easier to carry.
Scarcity is a real thesis here. It is also the reason the cash-flow math is hard.
How the Coverage Math Actually Runs
Most single-unit purchases on Miami Beach model below 1.00, and the gap widens as you move south. Coverage is monthly rent divided by the full monthly obligation: principal, interest, taxes, insurance, and any HOA dues. Run properly, that obligation is heavy relative to Miami Beach rents.
The modeled figures below are assumptions, not sourced market data. They assume 75 percent LTV, a 30-year amortization, Florida-average taxes and insurance, and rents from the research. HOA dues are excluded, so real coverage on condos runs lower.
| Scenario | Price basis | Rent input | Modeled coverage |
|---|---|---|---|
| North Beach avg | $338K | $1,950 1BR | About 0.90 |
| North Beach median | $470K | $1,950 1BR | About 0.65 |
| Mid-Beach median | $765K | $3,500 South Beach median | About 0.70 |
| South Beach fourplex | Listing-implied | $10,000 combined | Just under 1.00 |
Two takeaways. First, the standard 1.00x benchmark is hard to hit on a single unit at 75 to 80 percent leverage anywhere on the island. Second, the best numbers come from stacking units, not from picking a cheaper zip code.
The $3,500 rent comes from Zumper, which reports median rent in the South Pointe and South Beach area up 9.4 percent year over year, with 2BR up 23 percent. Citywide, Zumper shows average rent up 12.59 percent year over year. City-Data’s median gross rent of $2,148 is the more conservative anchor. Rents are climbing, but not fast enough to close a gap this wide on a single condo. On this island, price is the problem, not rent.
North Beach and Normandy Isles: Where the Basis Resets
North Beach is the strongest entry point on the island. The median has fallen to about $470K, homes are sitting around 133 days, and asking rents haven’t corrected with prices. Rent.com shows 1BR asking rents near $1,950 in North Beach and $1,916 in Isle of Normandy. Rent holding while price falls is the setup that improves coverage.
The caveat is that falling prices carry information. Redfin scores North Beach 6 out of 100 for competitiveness and shows the average price at $338K, down 53.3 percent. That average likely reflects a heavy mix of small units. A $338K entry against a $1,950 rent models near 0.90 including taxes and insurance, before HOA. Against the $470K median, it drops to about 0.65. Neither clears 1.00 at standard leverage.
So where does it pencil? Small multifamily. The older 1950s and 1960s buildings in North Beach and Normandy Isles are the closest thing the island has to a stackable product, and they carry a better rent-to-value ratio than South Beach or Mid-Beach. Inventory is thin, and an investor shopping a duplex or triplex here is competing with a very small pool of listings. Normandy Isles is also in the middle of a revitalization push, which the research ties to new development and infrastructure work.
One more pocket worth a look is Biscayne Point. A listed triplex there sits beside an empty lot and two newly completed four-story residential projects, and the listing markets expansion potential. That’s a value-add angle rather than a coverage angle, and expansion rights are the sort of thing to confirm with local professionals before underwriting.
Single-family at the lower price points exists too, mainly in North Beach and Normandy Isles. It’s scarce, though, and scarcity cuts both ways: little competition at a falling basis, but also little exit liquidity if you misjudge it.
The Fourplex Test (South Beach, Near Lincoln Road)
Stacking units is the only reliable way to get near 1.00 in the tourist core. A Homes.com listing near Lincoln Road shows four 2BR/1BA units on month-to-month leases, market rents estimated at $2,500 per unit, $120,000 in projected gross income, about $35,000 in expenses, and a 5.31 percent cap rate.
Run the numbers on those inputs at 75 percent LTV with full taxes and insurance, and coverage lands just under 1.00. That’s the honest read. A 5.31 percent cap rate sounds like a deal until you load a debt stack on it. At that cap rate, the property is priced roughly where the debt service is.
Two details matter. The leases are month-to-month, so the lender will care about how rents are documented and whether the appraiser’s market-rent schedule supports the $2,500 figure. And the expense estimate is the listing’s, not an underwriter’s.
When a file models just under 1.00, the structures a lender may review include a sub-1.00 program, interest-only structuring, or lower leverage with a larger down payment. Each of these changes the investor’s return model, and eligibility review depends on lender guidelines, credit, reserves, and property review. The 1.00x benchmark is common because rent covers the payment at that level. Select lenders do review lower ratios, but those files typically come with stronger credit, reduced leverage, or more cash to the table.
What the Deal Desk Sees in Markets Like This
Files in markets where price outruns rent, whether island condos, coastal resort submarkets, or land-locked luxury cores, tend to hinge on two things. The first is the condo or HOA dues line, which can swing coverage more than the interest assumption does. The second is the appraiser’s rent schedule, which for small multifamily has to be supported by comps instead of the seller’s pro forma. The cleaner files usually arrive with HOA budgets and the building’s lease or rental-cap documents in hand before the lender asks for them. On islands like this one, appraisers also lean on micro-neighborhood comps, so a North Beach file gets valued against North Beach, not against a citywide number.
Skip the Trophy Tier.
South of Fifth, the island estates, and Fisher Island are not DSCR plays. South of Fifth condos averaged about $3.0 million in the research, at roughly $1,500 per square foot. Against even the $3,500 South Beach median rent, coverage comes in under 0.20 before HOA. Landmark buildings like Apogee, Continuum, and Murano at Portofino trade on prestige and global buyer demand, not rent coverage.
Fisher Island, Star Island, Palm Island, the Venetian Islands, La Gorce, and North Bay Road are single-family estate markets, some with sales above $20 million. Minimal rental stacking, appreciation-driven. Not what DSCR was built for.
Mid-Beach deserves more nuance. Its per-square-foot values and recent annual gains reflect real demand for restored Art Deco and MiMo stock and the ultra-luxury towers. If you believe in continued appreciation, it works as a hold. As a coverage play, it doesn’t. Modeled at its median price against South Beach median rent, the ratio comes in well below the standard 1.00 floor.
Sunset Harbour sits on the western edge, known for boutique retail and restaurants. The research has no price or rent figures for it, so there’s no coverage case to make here.
Why Tenant Demand Holds
Long-term rental demand here is anchored by healthcare more than hospitality. Mount Sinai Medical Center is the only hospital and the largest employer on Miami Beach, with a 672-bed flagship on Biscayne Bay and more than 4,000 employees across its locations. Revelio Labs data shows headcount up 9.2 percent over roughly three years. The system is also building a second hospital in Westchester, but the flagship remains the anchor. Nurses, techs, residents, and administrative staff are the likely tenant base for workforce-priced units in North Beach and Mid-Beach.
The hotel and convention sector is the other big employer base, but the research has no verified headcount for it, so treat it as qualitative support. No four-year campus sits on the island. The University of Miami, about seven miles away in Coral Gables, employs more than 21,000 faculty and staff and is the second-largest employer in Miami-Dade County. Miami Dade College is the largest institution in the Florida College System. Those schools feed the broader labor pool rather than island rentals directly.
Income data shows the split. Point2Homes reports average household income at $144,213 against a median of $72,856. That gap between a high mean and a modest median explains why workforce-priced rentals and trophy condos coexist a few miles apart.
What Does a First-Time Investor Need to Bring?
Plan on 20 to 25 percent down on most files. Typical purchase leverage runs 75 to 80 percent LTV, and up to 85 percent is possible only on the strongest files when guidelines allow. The baseline coverage requirement is 1.00 on rent versus full PITIA, with credit tiers starting at a 620 floor and a 700 overlay for high-leverage deals. Reserves generally run about six months of PITIA, rising to about nine months above $1,500,000 in loan size. Standard programs go up to $3,000,000 in loan amount, with smaller balances routed through select lenders in the network. All of this is subject to lender guidelines, and details vary by borrower, property, and scenario.
DSCR vs. conventional financing
There are two common ways to finance an investment property in Miami Beach, FL, and they qualify you differently — here’s how investors weigh them.
Why investors choose it
- Qualifies on the property’s rental income — no personal tax returns, W-2s, or pay stubs needed to document income.
- No personal debt-to-income ceiling to clear, so existing mortgages and obligations don’t cap your borrowing the same way.
- Can be closed in an LLC, keeping the property inside a business entity.
- Built for scaling — not held to the limit on number of financed properties that conventional financing applies.
- Underwriting centers on the deal: generally qualifies when the rent covers the payment, a 1.00x coverage ratio being a common baseline (confirmed in underwriting).
- Designed specifically for investment property, including long-term and, where the program allows, short-term rentals.
Where it’s strong
- Often the lowest ongoing financing cost for a buyer who fully qualifies on personal income — a fit for a first property or a cost-first purchase.
Trade-offs for investors
- Requires full personal income documentation and must fit within a debt-to-income limit — salary, existing debts, and other mortgages all count.
- Typically held in your personal name rather than a business entity.
- Caps how many financed properties you can carry, which can become a ceiling as a portfolio grows.
- Evaluates you as a borrower as much as the property, which usually means more paperwork.
How investors usually choose: a first or single property often optimizes for the lowest financing cost; portfolio builders often optimize for leverage, vesting in an LLC, and scaling past conventional caps. The right answer depends on your goals, the property, and current guidelines — both paths run through select lenders in Lendmire’s wholesale network, with eligibility and terms confirmed in underwriting.
Condos add a layer. Lenders review the building as well as the unit, and HOA dues sit inside the monthly obligation. On an island where coverage is already tight, dues can decide whether a file works. LLC-titled purchases are common, subject to lender program eligibility.
Many non-QM platforms layer on state-specific overlays that shrink usable LTV. Lendmire’s wholesale channels are built to avoid that, and the platform’s DSCR programs show how the network is structured. Investors comparing paths can see how this stacks up in the comparison between DSCR and conventional financing. Newer investors who want the mechanics first should read the DSCR basics. Anyone who later wants to pull equity out of a stabilized North Beach hold can look at the refinance pathway for investor properties, but that is a second-step conversation.
Before underwriting any deal, verify current local rules, taxes, and insurance with qualified local professionals. Investors can reach Lendmire at 828-256-2183 to talk through a scenario.
Frequently Asked Questions
How do you qualify for a DSCR loan in Miami Beach?
Qualification centers on the property’s rent compared with its full monthly obligation, typically measured against a 1.00 benchmark. Lenders also review credit (a 620 floor on most programs), reserves of roughly six months, and the property itself. On Miami Beach, condo HOA dues and the appraiser’s rent schedule often drive the result. Final eligibility depends on lender guidelines.
What are the requirements for an investment property loan in Miami Beach, Florida?
Expect 20 to 25 percent down on most purchases, with up to 85 percent LTV on the strongest files. Credit tiers run from 620 to 700, and reserves are about six months of PITIA. Loan amounts go up to $3,000,000 on standard programs. Manufactured homes, log homes, and barndominiums fall outside these programs.
Does a single condo in Miami Beach clear 1.00 coverage?
Rarely, at standard leverage. Modeled with full taxes and insurance, North Beach units at a $338K to $470K basis land roughly between 0.65 and 0.90 before HOA, Mid-Beach lands at about 0.70, and South of Fifth falls well below that. Small multifamily is the better path. Sub-1.00 files may be reviewed by select lenders, but they usually require lower leverage, stronger credit, or more cash.
Why does North Beach come closer to working than South of Fifth?
Purchase basis explains the difference. North Beach’s median is near $470K with 1BR rents around $1,950, while South of Fifth condos average about $3.0 million. Rent doesn’t scale with price, so coverage weakens as the purchase price climbs. Mid-Beach’s 36.0 percent annual gain makes the problem worse for cash flow buyers.
Can Lendmire help arrange DSCR financing for an investment property in Miami Beach?
Yes. Lendmire arranges DSCR investor loans through wholesale lenders. Programs are generally reviewed around the property’s rental income instead of personal income documentation, subject to lender guidelines.
Where the Asymmetry Is
The mispricing sits in North Beach and Normandy Isles small multifamily. A median that has dropped 27.4 percent, 1BR asking rents still near $1,950, and a tight pool of older duplexes and triplexes make up the one corner of the island where basis has reset but rent hasn’t. Mid-Beach already priced in its run, and South of Fifth was never a cash-flow market. If a stackable North Beach building shows up at a basis that models near 1.00, it won’t sit long on a land-locked island that can’t build its way out of scarcity.
For current guidelines and terms, see Lendmire’s DSCR loan programs page.
About Lendmire
Lendmire (NMLS# 2371349) is a DSCR-focused mortgage broker that helps arrange investor financing across 41 markets, including Washington, D.C., through wholesale and investor-lending channels. DSCR eligibility is generally reviewed by the lender on the property’s rental income rather than personal income documentation, subject to lender guidelines. That works for self-employed investors, LLC operators, and portfolios above four financed properties. Scotsman Guide named Lendmire a Top Mortgage Workplace in both 2025 and 2026.
Get Started
Ready to find the right loan for you?
In about 30 seconds you can review financing options available for your investment property. No commitment required.
Informational only. Not a Loan Estimate, approval, or commitment to lend. Program availability and eligibility are subject to lender guidelines, credit approval, property review, and underwriting.
References
1. Redfin: North Beach housing market
2. Redfin: Mid Beach housing market
3. Redfin: Miami Beach housing market
4. City-Data.com: Miami Beach profile
5. Homes.com: Miami Beach multifamily listings
7. Zillow: Miami Beach home values
8. U.S. Census Bureau QuickFacts
9. Zumper: Miami Beach apartments
10. Rent.com: Miami Beach rent trends
11. Revelio Labs: Mount Sinai employee data
12. JMCO: Mount Sinai Westchester expansion
14. Point2Homes
This article is part of Lendmire’s DSCR loan program — full qualification details, guidelines, and scenarios live on the program page.
Related reading: Luxury Rental DSCR Loans In New Jersey · Jersey Shore Vacation Rental Loans: DSCR Financing In Ocean City, Cape May And Long Beach Island · DSCR Cash-out Refinance In New Jersey: Pulling Equity From A Rental
Guides: DSCR Loans in Miami Beach, FL · DSCR Loans in Florida
Brandon Miller
Founder & CEO, Mortgage Loan Originator, Lendmire LLC
- Mortgage Loan Originator · NMLS# 1129696 · Verify on NMLS Consumer Access
- North Carolina Real Estate Broker · License# 343312 · Verify on NCREC
- North Carolina Insurance Producer · License# 19053198 · Property, Casualty, Life, Health · Verify on NAIC SBS
- Lendmire LLC · Firm NMLS# 2371349 · Verify firm licensure
Compliance and disclosures. Lendmire (NMLS# 2371349) is a licensed mortgage broker and is not a direct lender, depository institution, financial advisor, or tax professional. Content in this article is general market analysis and educational information — not financial, legal, or tax advice for any specific situation. Lendmire does not guarantee loan approval; every transaction is subject to underwriting by the funding lender. Mortgage pricing and loan program guidelines are subject to change at any time without notice and vary by borrower characteristics, property type, and state regulations. Lendmire complies with Equal Housing Opportunity. Licensure verification: NMLS Consumer Access.