
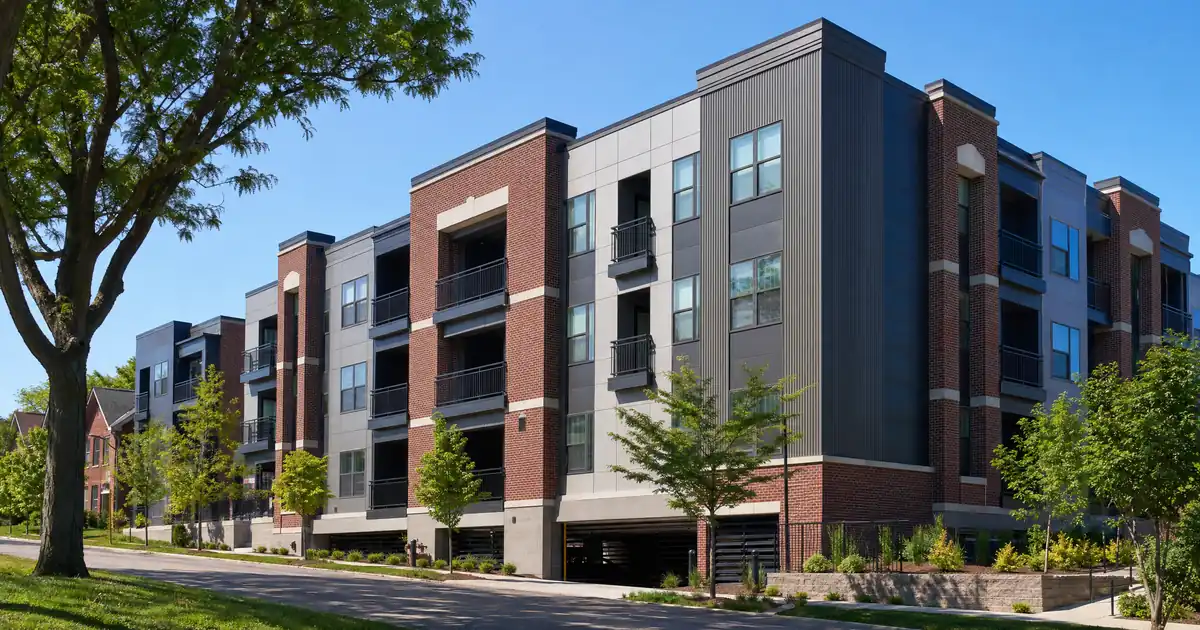
Which St. Louis neighborhood actually cash flows on a debt-coverage loan at today’s prices? The data splits sharply by submarket. Dutchtown’s price-to-rent profile models to workable coverage on a standard purchase, while Forest Park Southeast’s higher price point against its rent level does not clear coverage on the same financing structure, per Benzinga’s July 2025 St. Louis market coverage.
Key Takeaways: A St. Louis, Missouri investment property purchase is underwritten primarily on the subject property’s rent measured against its full monthly obligation, built around the purchase contract, a rent schedule, and an appraisal rather than the borrower’s traditional personal-income documentation — which is why a Dutchtown duplex priced well below the metro median can clear coverage where a Grove purchase at a much higher price point often cannot.
DSCR Calculator
Run the numbers in your market
Rate source: Freddie Mac 30-yr average via FRED® — Federal Reserve Bank of St. Louis · effective Jul 30, 2026
Prefilled with starting assumptions — enter your own rent or nightly figures, taxes, insurance, and HOA for a more accurate picture.
Program parameters update from Lendmire’s centralized guideline source. Taxes and insurance are editable estimates.
As of Jul 30, 2026 · General Freddie Mac market benchmark, not a Lendmire loan offer. Rent, nightly rate, occupancy, taxes, and insurance are editable estimates. Short-term rental figures are estimates only and vary significantly by season, property type, management approach, and local short-term-rental rules — confirm local regulations before relying on them. Qualifying income for short-term rentals varies by program — some use appraisal market rent, others use documented STR history or projections — and is confirmed in underwriting. Not a Loan Estimate, approval, or commitment to lend. Program availability and eligibility are subject to lender guidelines, credit approval, property review, and underwriting.
- Dutchtown’s below-metro-median price point and proportionate rent level model to roughly 1.10x-to-1.23x coverage depending on leverage, per Ark7.
- The Grove’s much higher purchase prices against comparatively modest rents model below 1.00x at standard leverage, per Benzinga.
- The National Geospatial-Intelligence Agency relocated a large share of its workforce to a new North City campus.
- Metro apartment vacancy has held in a narrow band since early last year, per Northmarq’s brokerage data.
- A median St. Louis fourplex costs well below typical single-family price points on a per-door basis, letting a four-unit rent roll outrun single-family coverage math at similar overall price levels.
St. Louis Market Snapshot
A quick read on the St. Louis investor landscape — figures come from the cited sources below. Confirm current property-level numbers before underwriting.
| Metric | Detail |
|---|---|
| Home prices | $247,250 median home price (Benzinga St. Louis Real Estate) |
| Typical rents | I-64 corridor rents >$1,430 (MMG Real Estate Advisors 2025) |
| Recent appreciation | City $224,000 (+8.2% yoy) (RE/MAX Best Choice Market Update) |
| Population | 279,695 population (Census Reporter (ACS 2024 1-yr)) |
| Employment | 11,500 employees (SSM Health St. Louis locations) |
Dutchtown and the South Side Corridor Clear Coverage — Barely
Dutchtown is the workforce-rental backbone of South City, and it is the neighborhood in this review that actually pencils for standard DSCR financing without a fight. Home prices here sit well below the metro’s higher-end submarkets, and rents have held firm against that lower basis, producing a favorable price-to-rent relationship, per Ark7’s neighborhood-level investor data. Modeling that pair through a standard purchase structure, typical county property-tax loads, and typical insurance costs for the area, coverage lands in the 1.10x-to-1.23x range depending on whether the buyer puts down 20 percent or 30 percent — tighter leverage buys a materially better ratio here than it does in almost any other St. Louis submarket.
That range sits below the 1.30x-to-1.50x figures some industry reports cite for South City and North County properties broadly, which likely reflect lower-leverage or cash-adjacent purchases rather than a standard 75-to-80 percent LTV file. Either way, the direction is the same: this is the corridor where rent actually outruns the payment obligation, not just the acquisition price.
Working DSCR brokers see a recurring pattern in older, low-basis rental markets like St. Louis’s South Side: the purchase price clears coverage comfortably on paper, but the file usually needs a fresh rent survey or signed lease to support the number, because tax and insurance escrows on century-old brick two-flats can run wider than a simple estimate suggests. That’s a documentation issue, not a coverage issue — but it’s the detail that trips up first-time investors moving from a rate sheet to an actual closing file.
Lendmire (NMLS# 2371349) arranges DSCR financing for St. Louis, Missouri investors through wholesale lenders across 41 markets, including Washington, D.C., and this is the exact property profile — workforce single-family and small multifamily well under the metro’s premium price tiers — where that network gets used most in this metro. Investors evaluating the full investor lending menu or Missouri DSCR investor loans can reach the team at 828-256-2183 to talk through a specific Dutchtown or Bevo Mill address before writing an offer.
The Grove’s Cortex Premium Doesn’t Cash Flow Like Dutchtown
Forest Park Southeast, branded locally as The Grove, is a genuinely different asset class from Dutchtown, and the coverage math shows it. Prices here have climbed well above the metro’s typical range, driven by proximity to the Cortex Innovation Community, a dense innovation district that has drawn substantial employer investment and continues to operate with near-zero commercial vacancy, according to architecture firm HOK’s project documentation. At full build-out, the district’s master plan calls for substantially more commercial space and permanent employment than exists today.
Run the same modeled financing assumptions used above — standard purchase leverage and typical Missouri tax-and-insurance loads — against The Grove’s price and rent, and coverage lands near 0.65x. Shaw, the historic, walkable neighborhood just south of Forest Park, carries a mid-range purchase price against comparatively modest rents and models to a similar sub-1.00x figure. Neither number kills the deal outright, but neither clears a standard 1.00x baseline on rent alone at today’s prices.
| Neighborhood | Price Level (relative to metro) | Rent Level (relative to metro) | Modeled Coverage (75% LTV) |
|---|---|---|---|
| Dutchtown | Well below metro median | Proportionate to price | ~1.16x |
| Shaw | Mid-range | Modest relative to price | ~0.64x |
| Forest Park Southeast (The Grove) | Well above metro median | Elevated, but not proportionate to price | ~0.65x |
Terms vary by lender guidelines, property type, leverage, credit profile, and full file review.
This is where a sub-1.00x program, an interest-only structure, or a larger down payment to reduce the loan balance becomes the conversation, rather than a standard rent-covers-payment purchase. Some lenders in the wholesale channel will review files below a 1.00x ratio, generally with lower leverage, stronger reserves, or other compensating factors — qualification in every case depends on lender guidelines, credit profile, and the specific property under review, not a guarantee tied to price or neighborhood.
Central West End Versus St. Charles County: Rent Now or Appreciation Later?
Investors chasing the highest rent numbers in the metro land in the Central West End, but the growth trajectory there tells a more complicated story than the headline rent figure suggests. The Central West End, anchored by the BJC/Washington University academic medical complex, sits along the I-64 corridor where rents rank among the highest in the region, per MMG Real Estate Advisors’ 2025 market forecast. Yet CWE’s rent growth has cooled recently, a function of new supply hitting the submarket at the same time demand growth leveled off.
Compare that to St. Charles County, which has posted stronger recent rent growth with a firmer forward growth outlook, per the same MMG report. That’s the appreciation-versus-cash-flow bifurcation in one data set: CWE offers the highest absolute rent roll and the steadiest tenant base — hospital staff, academic-conference visitors, and BJC HealthCare’s substantial regional workforce across 24 hospitals — but near-term rent bumps have stalled. St. Charles is the opposite trade: a thinner current yield in exchange for the stronger forward growth curve. Neither is wrong; they’re different bets on the same metro.
Soulard’s Hybrid Rental Identity
Soulard doesn’t fit neatly into either the cash-flow or appreciation bucket — it’s the metro’s hybrid market, built on the city’s oldest residential architecture and an events calendar that includes one of the largest Mardi Gras celebrations outside New Orleans. Long-term tenant demand comes from young professionals and hospitality workers who want walkable proximity to downtown; short-term demand spikes hard around Cardinals home stands and event weekends. Investors weighing a blended long-term-plus-short-term underwriting approach should review the DSCR fundamentals and, separately, how projected short-term income gets treated on a file — the mechanics differ from a standard long-term lease and current local permitting rules should be confirmed with a qualified local professional before underwriting any Airbnb-style income into a purchase.
Clayton, Webster Groves, and the Value-Suburb Alternative
The inner-ring suburbs split into two distinct investor plays, and conflating them is a common first-time mistake. Clayton, Webster Groves, and Kirkwood carry premium price points well above the metro average, drawing a tenant base of relocating corporate and healthcare professionals — steady occupancy, lower turnover, but a compressed yield relative to acquisition cost. These are long-hold, quality-focused purchases more than cash-flow plays.
Maplewood and University City sit on the other side of that line, with more moderate pricing and demand anchored directly by Washington University in St. Louis, a large private research university with a substantial student population. A 24-unit multifamily asset in Maplewood currently sits fully leased, in a submarket carrying strong household incomes and home values above much of the surrounding area, per brokerage listing data — evidence that small-to-mid multifamily can reach full occupancy in these value suburbs even where single-family coverage runs thinner. That’s a meaningfully different risk profile than the premium suburbs, at a meaningfully lower entry price.
North City’s New Anchor: NGA’s Relocation
The single biggest structural change to St. Louis rental demand in this review isn’t a neighborhood trend — it’s a federal relocation. The National Geospatial-Intelligence Agency opened its new campus in North St. Louis, relocating a substantial share of its workforce from downtown into a newly built facility. Beyond the agency itself, the broader geospatial and location-technology sector supports a meaningful number of regional jobs and contributes a significant economic impact to the metro, per Missouri Partnership.
That’s a durable, non-cyclical employment anchor landing in and around Old North St. Louis, St. Louis Place, and the broader near-north corridor — submarkets that also include emerging value plays like Baden, where acquisition costs still sit well below replacement cost. It’s worth flagging that this part of the metro also carries structurally higher vacancy than the citywide blend: North City and downtown are running above the metro’s average vacancy rate, per Northmarq’s brokerage data, so investors underwriting these corridors should build in vacancy assumptions specific to the submarket rather than importing the citywide figure. The federal jobs are real; the turnover risk in the surrounding rental stock is real too, and a defensible DSCR file treats both.
Fourplex Math: Why Four Doors Beat One
A single-family purchase and a fourplex purchase at the same total price point are not the same coverage bet, and St. Louis makes that gap unusually visible. The median fourplex cost across the metro sits well below typical single-family price points on a per-door basis, per Fourplex.io. Combined rent across four units at that basis clears a debt-coverage threshold far more easily than a single detached home priced anywhere near The Grove or Shaw, simply because the income side of the ratio stacks four ways instead of one. This is the case for looking at duplex, triplex, and fourplex stock specifically in South City and near-university submarkets before defaulting to single-family comps.
What a St. Louis DSCR Purchase File Actually Requires
DSCR programs vary by lender, and coverage requirements differ across the wholesale channel. A 1.00x ratio — the point at which rent covers the full monthly obligation, including taxes, insurance, principal, and interest — serves as the floor on select programs, with many standard programs requiring stronger coverage than that. None of this relies on the borrower’s personal income documentation the way a conventional loan does. On most files, typical purchase leverage runs 75 to 80 percent LTV, meaning 20 to 25 percent down, with a ceiling near 85 percent available on the strongest files where guidelines allow. Credit-score minimums generally start around 620, though tiers near 680 to 700 tend to unlock the higher end of that leverage range. Reserve requirements typically run around six months of the full monthly obligation on standard balances.
Loans made to an LLC entity are common in this asset class and workable subject to lender program eligibility, which matters here given how many St. Louis investors title properties in an entity for portfolio and liability reasons. Loan sizing on the wholesale side generally extends up to $3,000,000 on standard programs, though smaller balances — the kind common on a modestly priced Dutchtown duplex — route through select lenders in the network rather than the standard program minimum. All of this is guidance, not a guarantee: exact eligibility depends on lender guidelines, credit profile, reserves, the specific property under review, and review details subject to lender overlays.
Investors weighing whether debt-coverage financing beats a conventional investment loan for a specific St. Louis address can review how it compares to conventional financing directly. And for investors thinking a step ahead — building equity in a South City purchase before pulling cash back out for the next deal — rate-and-term and cash-out refi details are worth a separate look once a property has seasoned; cash-out leverage caps run lower than purchase-side maximums, generally capped at 75 percent LTV.
Frequently Asked Questions
How do you qualify for a DSCR loan in St. Louis, Missouri?
Qualification centers on the subject property’s rent measured against its full monthly obligation — taxes, insurance, principal, and interest — rather than the borrower’s personal income documentation. A completed file typically includes a purchase contract or existing lease, a rent schedule or appraisal-supported rent estimate, credit history, and reserves, all reviewed against the specific lender’s guidelines.
DSCR vs. conventional financing
Two common ways to finance an investment property in St. Louis, MO. They qualify you differently — here’s how investors weigh them.
Why investors choose it
- Qualifies on the property’s rental income — no personal tax returns, W-2s, or pay stubs needed to document income.
- No personal debt-to-income ceiling to clear, so existing mortgages and obligations don’t cap your borrowing the same way.
- Can be closed in an LLC, keeping the property inside a business entity.
- Built for scaling — not held to the limit on number of financed properties that conventional financing applies.
- Underwriting centers on the deal: generally qualifies when the rent covers the payment, a 1.00x coverage ratio being a common baseline (confirmed in underwriting).
- Designed specifically for investment property, including long-term and, where the program allows, short-term rentals.
Where it’s strong
- Often the lowest ongoing financing cost for a buyer who fully qualifies on personal income — a fit for a first property or a cost-first purchase.
Trade-offs for investors
- Requires full personal income documentation and must fit within a debt-to-income limit — salary, existing debts, and other mortgages all count.
- Typically held in your personal name rather than a business entity.
- Caps how many financed properties you can carry, which can become a ceiling as a portfolio grows.
- Evaluates you as a borrower as much as the property, which usually means more paperwork.
How investors usually choose: a first or single property often optimizes for the lowest financing cost; portfolio builders often optimize for leverage, vesting in an LLC, and scaling past conventional caps. The right answer depends on your goals, the property, and current guidelines — both paths run through select lenders in Lendmire’s wholesale network, with eligibility and terms confirmed in underwriting.
What credit score do I need for a DSCR loan in St. Louis?
Minimums generally start around 620 on the wholesale side, though credit tiers near 680 to 700 tend to unlock higher leverage and more favorable terms. Exact requirements vary by lender and by the specific property and coverage ratio involved.
Can I use a DSCR loan to buy a duplex, triplex, or fourplex in St. Louis?
Yes — small multifamily is a common and often favorable use case for DSCR financing in this metro, since combined rent across multiple units can support coverage more easily than a single-family purchase at a comparable price point, subject to lender program eligibility.
Does Lendmire lend directly, or broker DSCR loans for St. Louis properties?
Lendmire (NMLS# 2371349) is a non-QM DSCR mortgage broker, not a direct lender. It arranges financing through wholesale lenders across 41 markets, including St. Louis, matching a given property and borrower profile to lenders whose guidelines fit the file.
How much down payment is typically required for a St. Louis investment property DSCR loan?
Most standard purchase files run 20 to 25 percent down, corresponding to 75-to-80 percent LTV, with a ceiling near 85 percent available on the strongest files where lender guidelines allow. Reserve requirements and coverage ratio also factor into the final leverage a specific file can support.
About Lendmire
Lendmire is a DSCR-focused mortgage broker, not a direct lender, helping arrange investor financing through wholesale and investor-lending channels across 41 markets nationwide, operating under NMLS# 2371349. Rental-income-based DSCR eligibility is generally reviewed by the lender on the property’s rent rather than the borrower’s personal income documentation, subject to lender guidelines — a structure that tends to fit self-employed investors, LLC operators, and portfolios above four financed properties particularly well. Scotsman Guide has named Lendmire a top-ranked workplace in 2026 and recognized the firm in 2025 as well. Nothing here is a guarantee of approval, pricing, or timeline; every file is subject to lender guidelines, underwriting, and full review of the specific property and borrower profile.
St. Louis’s own price data still disagrees with itself — Redfin, Zillow, and local brokerage reports place the citywide median at different points depending on methodology and month, with local brokerage data pointing to continued year-over-year price growth citywide, per RE/MAX Best Choice’s spring market update. That disagreement is a reason to underwrite the specific address, not the citywide aggregate. So: does the next property under consideration look more like Dutchtown’s coverage math, or The Grove’s premium?
Get Started
Ready to find the right loan for you?
In about 30 seconds you can review financing options available for your investment property. No commitment required.
Informational only. Not a Loan Estimate, approval, or commitment to lend. Program availability and eligibility are subject to lender guidelines, credit approval, property review, and underwriting.
References
1. Benzinga — St. Louis Real Estate Investing
2. Ark7 — Best Neighborhoods to Invest in St. Louis
3. National Geospatial-Intelligence Agency
4. MMG Real Estate Advisors 2025
5. RE/MAX Best Choice Market Update
6. Census Reporter (ACS 2024 1-yr)
7. SSM Health St. Louis locations
9. Missouri Partnership — Geospatial Industry
10. Fourplex.io
11. Scotsman Guide — Top Workplaces 2026
12. Scotsman Guide — Top Workplaces 2025
This article is part of Lendmire’s DSCR loan program — full qualification details, guidelines, and scenarios live on the program page.
Related reading: DSCR Loans in St. Louis, Missouri: Investor Financing for Soulard, The Hill, Dutchtown & Real Estate Investors · DSCR Cash Out Refinance Webster Groves Missouri · Cash Out Refinance Investment Property in Webster Groves
Guides: DSCR Loans in St. Louis, MO · DSCR Loans in Missouri
Brandon Miller
Founder & CEO, Mortgage Loan Originator, Lendmire LLC
- Mortgage Loan Originator · NMLS# 1129696 · Verify on NMLS Consumer Access
- North Carolina Real Estate Broker · License# 343312 · Verify on NCREC
- North Carolina Insurance Producer · License# 19053198 · Property, Casualty, Life, Health · Verify on NAIC SBS
- Lendmire LLC · Firm NMLS# 2371349 · Verify firm licensure
Disclosure information. Lendmire is a state-licensed mortgage brokerage under NMLS# 2371349. Lendmire is not a depository institution, direct lender, or financial advisor — all loans referenced are placed through wholesale lender partners and are subject to each lender's underwriting standards. This article is provided for general informational purposes and is not a commitment to lend, nor does it constitute financial, legal, or tax advice. Loan programs, terms, rates, and qualification standards change without notice and depend on borrower profile, property type, and the state in which the subject property is located. Equal Housing Opportunity provider. NMLS Consumer Access: nmlsconsumeraccess.org.