
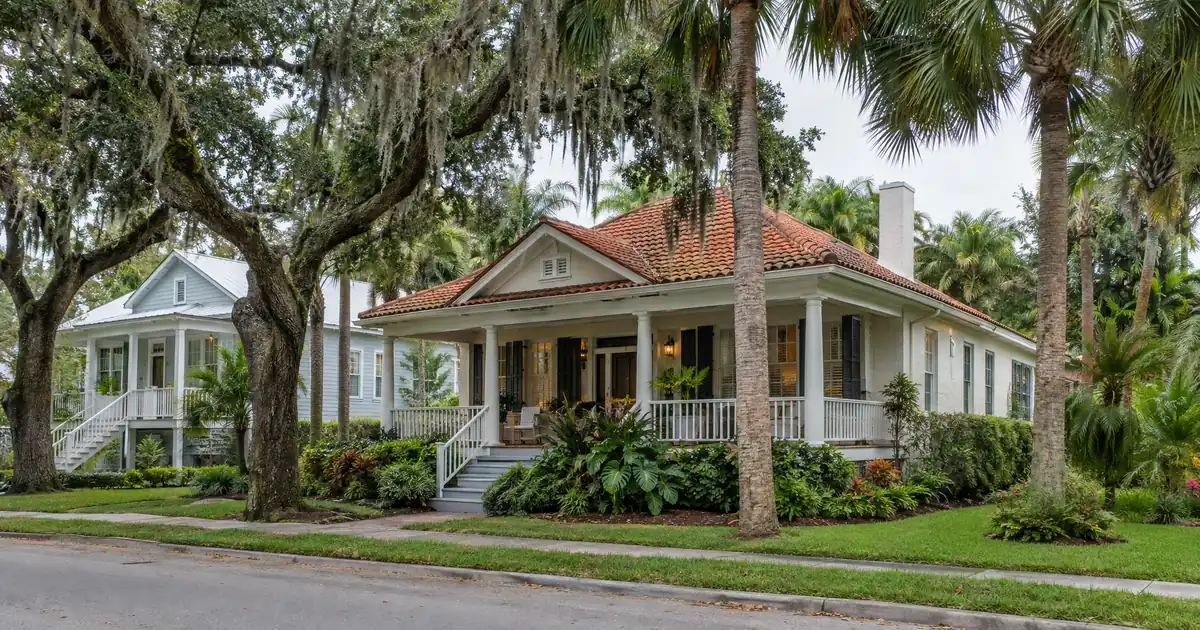
Two things are moving at once in South Miami rentals, and they pull in opposite directions. Asking rents are climbing: Zumper shows an average of $3,440, up 11% year over year, though on a thin sample of 89 listings. Meanwhile, countywide new-lease rents are flat and a big supply pipeline is still working through. Over the next 6 to 18 months, the question for an owner is whether in-place rent supports a cash-out at the 75% loan-to-value ceiling or leaves the coverage ratio short. Home values here are high, so that answer depends mostly on what you own.
DSCR Cash-Out Calculator
Run the cash-out numbers in South Miami, FL
Rate source: Freddie Mac 30-yr average via FRED® — Federal Reserve Bank of St. Louis · effective Sep 24, 2026
Prefilled with starting assumptions — enter your property’s value, balance, taxes, and insurance for a more accurate picture.
Program parameters update from Lendmire’s centralized guideline source. Taxes and insurance are editable estimates.
As of Sep 24, 2026 · General Freddie Mac market benchmark, not a Lendmire loan offer. Property value, balance, taxes, and insurance are editable estimates. Maximum loan-to-value varies by lender, program, property type, and seasoning. Not a Loan Estimate, approval, or commitment to lend. Program availability and eligibility are subject to lender guidelines, credit approval, property review, and underwriting.
The Quick Read:
A DSCR cash-out refinance on a South Miami, Florida investment property is underwritten primarily on the rental income the property produces, measured against its full monthly obligation, and the proceeds are limited by the loan-to-value ceiling, seasoning, and reserves. Structure type decides whether the coverage number clears.
- Multi-unit and house-plus-second-unit properties carry the strongest odds of clearing 1.00 here.
- Single-family at city-level values tends to land well below 1.00 on modeled coverage.
- Cash-out LTV tops out at 75%, with ownership seasoned about 6 months from title recording.
- New-lease rents across the county are flat while in-place renewals run higher.
- Adjacent South Miami Heights offers lower price points for better rent-to-value.
South Miami Market Snapshot
A quick read on the South Miami investor landscape — figures come from the cited sources below. Confirm current property-level numbers before underwriting.
| Metric | Detail |
|---|---|
| Home prices | $895K median list price (Redfin, Miami-Dade multifamily) |
| Typical rents | $1,977 median gross (city-data.com South Miami) |
| University enrollment | 20,104 students (University of Miami) |
| Employment | 30,000+ employees (Baptist Health careers) |
| Vacancy | 4.6% (50+ units) (Miami Realtors South Florida) |
Where the Rent-to-Value Gap Shows Up
South Miami is a high-value, high-income city, and that is exactly what makes cash-out coverage tight on single-family homes. A Census-derived estimate on city-data.com puts median home or condo value at $980,233 against a median gross rent of $1,977. That blended rent includes older, lower-rent leases, so it understates what a new tenant pays. Still, the gap is wide.
Run the numbers on a modeled single-family at the city-level median value, taking the $3,440 Zumper average as rent and a 75% LTV. Once taxes and insurance go into the full monthly obligation, modeled coverage lands somewhere in the 0.5 to 0.6 range. Those are modeled assumptions, not sourced market data. A house like that doesn’t clear the standard 1.00 benchmark, and more equity doesn’t fix it, because the ratio is rent against payment. Terms vary by lender guidelines, property type, leverage, credit profile, and full file review.
When a property sits below 1.00 on long-term rent, a lender may still review it under a sub-1.00 program, an interest-only structure, or with lower leverage and more cash retained. Each of those typically brings stronger compensating factors and different pricing, and none is a given. Eligibility depends on lender guidelines, credit profile, reserves, and property review.
Multi-Unit and Second-Unit Properties Are the Better Fit
Income stacking is how cash-out proceeds pencil in this market. Multiple leases count toward one property’s coverage ratio, so a duplex or fourplex spreads a high basis across more rent.
Redfin shows a median asking price of $895K for Miami-Dade County multifamily listings. That is a county figure, not South Miami, and no reliable South Miami duplex or fourplex price or rent data turned up in the research. So treat the following as a modeled illustration only.
Say you own a duplex valued near that county median, with two 2-bedroom units. Using RentCafe’s $3,001 average 2-bedroom rent for both units, and refinancing at 75% LTV, modeled coverage including taxes and insurance comes in around 1.0x to 1.1x. That is borderline. It shows why the same dollar of equity behaves very differently on a two-unit building than on a single-family house. Exact terms depend on the lender’s guidelines, property type, leverage, and a full review of the borrower’s file.
The other route is a single-family home with a legal second unit or ADU. Whether the unit is legal, and whether the appraiser counts its rent, is a verification item, not an assumption. Condos and townhomes are the weakest fit, since association dues sit inside the monthly obligation and drag coverage down. The HOA questionnaire also has to come back complete before the deal works.
The Equity Math: Seasoning, 75%, and What Actually Limits Proceeds
For cash-out, the program ceiling is 75% of the appraised value, and ownership generally has to season for about 6 months from title recording. The settlement statement documents that date. Files that assume the seasoning requirement away get kicked back.
The proceeds are not simply 75% minus the payoff. Three things cap them in practice:
1. Appraised value. South Miami sales volume is thin, so the appraiser leans on comps from Coral Gables, Pinecrest, and Kendall. A recent sale-price sample here swings widely, so don’t assume a trend. If the number comes in light, an appraisal reconsideration with in-neighborhood sales and condition adjustments is a routine step.
2. Rent used for lender review. The coverage ratio has to clear the lender’s floor, typically a 1.00 benchmark, though some programs review lower with compensating factors. Rent used for lender review is the lower of the lease and the appraiser’s market rent.
3. Reserves. Reserves of about 6 months of PITIA are typical, and larger balances carry a higher ask (about 9 months above $1,500,000). Document them with statements, not estimates.
Equity available is never a guaranteed cash figure. It depends on all three, subject to lender guidelines and credit approval.
What Soft New-Lease Rents Do to the Appraisal
Underwrite the cash-out on flat rents. The Miami Realtors South Florida rental report shows asking-rent growth of 0.6% across the Miami market area, down from 2.0% a year earlier. Completions of 11,489 outpaced absorption of 8,476 over 12 months. New leases signed 0.5% below in-place rents, while renewals came in 3.4% higher.
For a South Miami owner, that is the practical point. A tenant renewed above market looks good on the rent roll, but an appraiser who sees new leases signing lower may use a market rent below your current lease. Cash-out sizing built on an aggressive pro forma gets pulled back at that stage.
Vacancy isn’t alarming. The same report shows 4.6% vacancy in buildings of 50-plus units, even after roughly 42,000 units were built since 2019, about 21% of existing inventory. That is a large-building figure, not small South Miami property data. It does support a stable-occupancy assumption in a rent schedule, without proving it for a single duplex.
A Miami Finance Review summary of Yardi and MMG data shows 94.6% occupancy and annual rent change of -0.2%. It also shows 15,481 units still under construction. Supply pressure is easing, not gone. A refinance placed now should assume rents hold, not recover.
Submarkets: Where Cash-Out Math Gets Better or Worse
Downtown SoMi and the Sunset Drive core. Walkable and mixed-use beside the Metrorail station. Tenants here are transit-oriented renters and people tied to the hospital and university employment base. Values are high, so only multi-unit or income-stacked properties tend to carry coverage. An FIU-hosted city profile lists 1,785 businesses on the city’s Shop SoMi map, which shows how much of the core is commercial.
Hometown District and the US-1 corridor. The city’s commercial hub sits in the triangle formed by US-1, Sunset Drive, and Red Road. For a residential cash-out, the main variable is whether a mixed-use or multi-unit building is appraised as residential or commercial income. That affects which program applies.
Dadeland edge. Adjacent, and a base for Metrorail commuters. Miami-Dade County is renovating the Dadeland South station to connect with the county’s first Bus Rapid Transit line on the South Dade TransitWay. Better transit access is a long-term demand support. It doesn’t give a rent level.
South Miami Heights. This is the workforce-priced alternative. Redfin shows a median sale price of $580K, up 9.5% year over year, which is a far lower basis than the city’s $980,233 value estimate. It is a separate market, not South Miami, and each needs its own coverage run. Same goes for Coral Gables duplexes and West Perrine new-construction duplexes, which Redfin’s Miami listings show as adjacent small-multifamily options.
Which is the better play? It’s a genuine toss-up. South Miami proper holds value and rents better, since Yardi data shows Coral Gables, which borders the city, among Miami-Dade’s stronger rent performers. South Miami Heights pencils better on coverage but with a different tenant base and less exit liquidity. Investors chasing appreciation could argue the other way.
Why Tenant Demand Holds Up
Demand here rests on jobs and transit, not a single employer. Census Reporter counts 12,277 residents in 2.3 square miles, with a median household income of $94,507. Data USA lists professional services (1,071 residents), health care (1,027), and education (743) as the top resident sectors. RentCafe reports that 41% of households rent.
The anchors are close. Baptist Health South Florida reports more than 30,000 employees across 12 hospitals, and Baptist Health South Miami Hospital sits inside the city. The University of Miami in adjacent Coral Gables enrolled 20,104 students, per Wikipedia. One caution: Marcus & Millichap’s outlook, as reported by South Florida Agent Magazine, flags slower job growth and immigration headwinds as demand risks. Treat that as a risk, not a forecast.
What These Files Typically Look Like
DSCR files in markets like this one typically look the same on paper: high basis, rents that sit between a stale lease and an optimistic ask, and an appraisal that comes in on the conservative side. The files that clear tend to have a current lease schedule, a rent figure the appraiser can support with comps, and reserves already documented. The ones that stall usually have a pro forma built on asking rents and a lender who underwrites to the lower number. Pull entity documents, lease evidence, and the settlement statement showing the recording date before the file goes in, not after.
DSCR vs. conventional financing
There are two common ways to finance an investment property in South Miami, FL, and they qualify you differently — here’s how investors weigh them.
Why investors choose it
- Qualifies on the property’s rental income — no personal tax returns, W-2s, or pay stubs needed to document income.
- No personal debt-to-income ceiling to clear, so existing mortgages and obligations don’t cap your borrowing the same way.
- Can be closed in an LLC, keeping the property inside a business entity.
- Built for scaling — not held to the limit on number of financed properties that conventional financing applies.
- Underwriting centers on the deal: generally qualifies when the rent covers the payment, a 1.00x coverage ratio being a common baseline (confirmed in underwriting).
- Designed specifically for investment property, including long-term and, where the program allows, short-term rentals.
Where it’s strong
- Often the lowest ongoing financing cost for a buyer who fully qualifies on personal income — a fit for a first property or a cost-first purchase.
Trade-offs for investors
- Requires full personal income documentation and must fit within a debt-to-income limit — salary, existing debts, and other mortgages all count.
- Typically held in your personal name rather than a business entity.
- Caps how many financed properties you can carry, which can become a ceiling as a portfolio grows.
- Evaluates you as a borrower as much as the property, which usually means more paperwork.
How investors usually choose: a first or single property often optimizes for the lowest financing cost; portfolio builders often optimize for leverage, vesting in an LLC, and scaling past conventional caps. The right answer depends on your goals, the property, and current guidelines — both paths run through select lenders in Lendmire’s wholesale network, with eligibility and terms confirmed in underwriting.
Rent sources also disagree by $500 to $1,000 on a given unit type. RentCafe averages $2,906 across apartments, driven by larger buildings, while Zumper averages $3,440 on a small listing sample. Pick the source that matches your property type, and expect the appraiser to pick a conservative one.
For program background, Lendmire’s DSCR walkthrough explains how the coverage ratio works, and the DSCR-versus-conventional breakdown covers why rental income, not traditional employment income, drives the file. Details on rate-and-term and cash-out refi and pulling equity with a DSCR cash-out cover the mechanics. Investors can also review DSCR loan options for Florida investors. Verify current local rental rules, taxes, and insurance with qualified local professionals before sizing any deal. Loan terms vary by borrower, property, and scenario, and nothing here is a commitment to lend. To discuss a specific property, call 828-256-2183.
Where the Proceeds Go Next
Cash-out only makes sense if the next deal clears on its own numbers. Pulling equity from a high-basis South Miami property to buy in a lower-basis market, such as a workforce duplex in an adjacent submarket, often improves the combined coverage picture. Pulling it to buy another thin single-family does not. If your refinance drops a property’s coverage ratio near the floor, the equity you extracted is carrying a position you can’t easily exit.
Frequently Asked Questions
How do you qualify for a DSCR cash-out refinance in South Miami?
Qualification centers on the property’s rent compared with its full monthly obligation (principal, interest, taxes, insurance, and any HOA dues). Typical guideline items are a coverage ratio at or above 1.00, a credit score tier from 620 up, about 6 months of ownership seasoning, and about 6 months of PITIA in reserves. All of it is subject to lender guidelines and property review.
What are the requirements for an investment property cash-out loan in South Miami, Florida?
Expect a 75% maximum LTV on cash-out, documented ownership for about 6 months from title recording, and entity documents if the property is held in an LLC, subject to lender program eligibility. Loan amounts run up to $3,000,000 on standard programs. Manufactured homes, log homes, and barndominiums fall outside these programs.
Why does single-family coverage run so tight in South Miami?
The Census-derived median value is $980,233 against a median gross rent of $1,977, and even asking rents near $3,440 leave modeled coverage well under 1.00 once taxes and insurance are included. Multi-unit properties and houses with a legal second unit spread that basis across more rent. They are where cash-out most often pencils.
Does soft new-lease rent growth hurt a cash-out appraisal?
Yes, it can. Countywide, new leases signed 0.5% below in-place rents while renewals ran 3.4% higher, so an appraiser may use a market rent below your current lease. Size the cash-out on flat rents, and keep recent comparable leases in the file.
For current guidelines and terms, see Lendmire’s DSCR loan programs page.
About Lendmire
Lendmire (NMLS# 2371349) is a mortgage brokerage focused on DSCR investor financing, helping arrange programs through wholesale and investor-lending channels in 41 markets, including Washington, D.C. DSCR loans are evaluated by the lender on property cash flow rather than personal income, subject to lender guidelines, supporting LLC closings and accommodating investors with four or more financed properties. Scotsman Guide named Lendmire a Top Mortgage Workplace in both 2025 and 2026.
Get Started
Ready to find the right loan for you?
In about 30 seconds you can review financing options available for your investment property. No commitment required.
Informational only. Not a Loan Estimate, approval, or commitment to lend. Program availability and eligibility are subject to lender guidelines, credit approval, property review, and underwriting.
References
1. Zumper, South Miami rent research
2. Redfin
4. Wikipedia
5. Baptist Health South Florida careers
6. Miami Realtors South Florida Rental Market Report
7. RentCafe, South Miami rent trends
8. Miami Finance Review, Miami Multifamily Market
10. Miami-Dade County, Dadeland South Intermodal Project
11. Redfin
13. Baptist Health South Miami Hospital
14. as reported by South Florida Agent Magazine
15. 2025
16. 2026
This article is part of Lendmire’s investment property cash-out refinance program — full qualification details, guidelines, and scenarios live on the program page.
Related reading: DSCR Loans Miami: Investor Financing for Miami Rental Properties, Airbnb, and Real Estate Investors · Cash Out Refinance Investment Property in Captiva, Florida: How the Rent Math Clears at 75% LTV · DSCR Cash Out Refinance in Captiva, Florida: How the Rent Math Clears at 75% LTV Here
Guides: Investment Property Cash-Out Refinance in Florida
Brandon Miller
Founder & CEO, Mortgage Loan Originator, Lendmire LLC
- Mortgage Loan Originator · NMLS# 1129696 · Verify on NMLS Consumer Access
- North Carolina Real Estate Broker · License# 343312 · Verify on NCREC
- North Carolina Insurance Producer · License# 19053198 · Property, Casualty, Life, Health · Verify on NAIC SBS
- Lendmire LLC · Firm NMLS# 2371349 · Verify firm licensure
Legal disclosures. Lendmire (NMLS# 2371349) is a state-licensed mortgage brokerage that arranges financing through wholesale lender relationships. Lendmire is not a direct lender, depository institution, or registered financial advisor. The discussion above is general informational content about real estate financing — it is not financial, legal, or tax advice, and readers should consult licensed professionals for guidance on their individual circumstances. Loan inquiries are subject to lender underwriting; this article does not represent a commitment to lend. Loan terms, rates, and qualification standards vary by borrower, property, and state, and are subject to change at any time. Equal Housing Opportunity. NMLS Consumer Access: nmlsconsumeraccess.org.